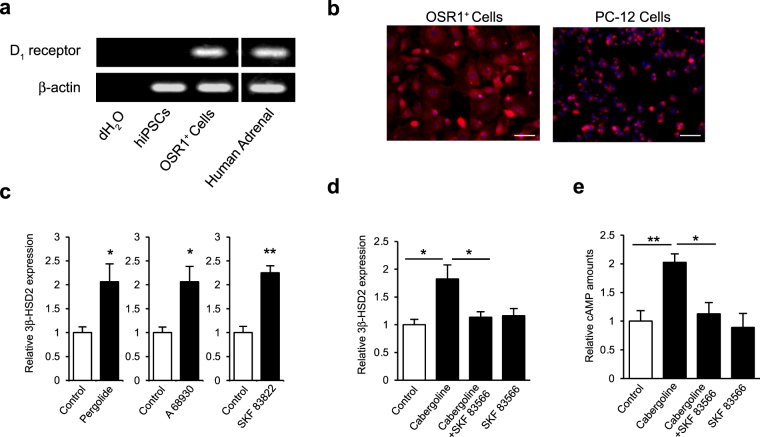
Figure 3.
Expression of dopamine D1 receptors on OSR1+ cells and effects of D1 receptor agonists and an antagonist. (a) RT-PCR analysis of dopamine D1 receptor mRNA expression in OSR1+ cells. (b) Immuno-fluorescence staining of dopamine D1 receptors on OSR1+ cells. PC-12 cells are shown for comparison (positive control). Scale bar, 50 μm. (c) Levels of 3β-HSD2 mRNA expression in OSR1+ cells treated with dopamine D1 receptor agonists. Cells were treated with 10 μM pergolide, 10 μM A 68930 and 1 μM SKF 83822. Expression levels are normalised to levels of a housekeeping gene, β-actin. Student’s t-test was used for comparison of two groups. *P < 0.05; **P < 0.01. Data represent mean ± SEM of four independent experiments (n = 4). (d) Levels of 3β-HSD2 mRNA expression in OSR1+ cells treated with cabergoline and D1 receptor antagonist. Cells were treated with 20 µM cabergoline and 10 μM SKF 83566. Statistical analysis was performed by one-way ANOVA followed by the Tukey-Kramer test. *P < 0.05. Data represent mean ± SEM of four independent experiments (n = 4). (e) Levels of intracellular cAMP in OSR1+ cells treated with 20 µM cabergoline and 10 μM SKF 83566. Statistical analysis was performed by one-way ANOVA followed by the Tukey-Kramer test. *P < 0.05; **P < 0.01. Data represent mean ± SEM of six independent experiments (n = 6).

