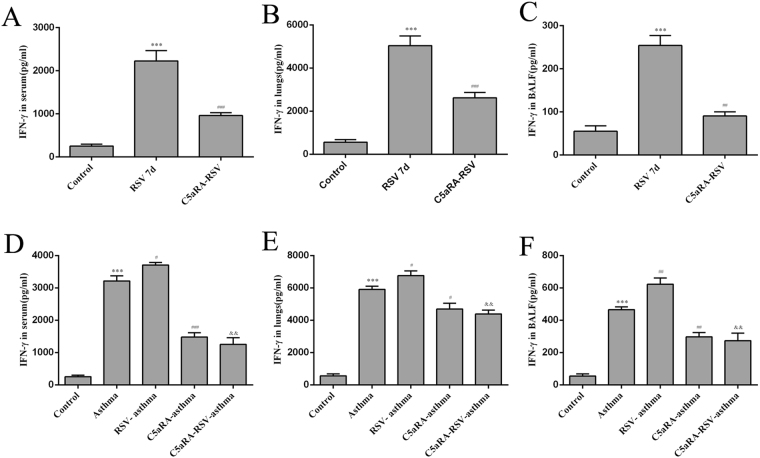
Figure 6.
The levels of IFN-γ. (A–C) Serum IFN-γ levels (A), Lung tissue IFN-γ levels (B) and BALF IFN-γ levels (C) in control, RSV and C5aRA-RSV mice. *P < 0.05, **P < 0.01, ***P < 0.001 vs. control; #P < 0.05, ##P < 0.01, ###P < 0.001 vs. RSV 7d. (D–F) Serum IFN-γ levels (D), Lung tissue IFN-γ levels (E) BALF IFN-γ levels (F) in control, asthma, RSV-asthma, C5aRA-asthma and C5aRA-RSV-asthma mice. *P < 0.05, **P < 0.01, ***P < 0.001 vs. control; #P < 0.05, ##P < 0.01, ###P < 0.001 vs. asthma; &P < 0.05, &&P < 0.01, &&&P < 0.001 vs. RSV-asthma.

