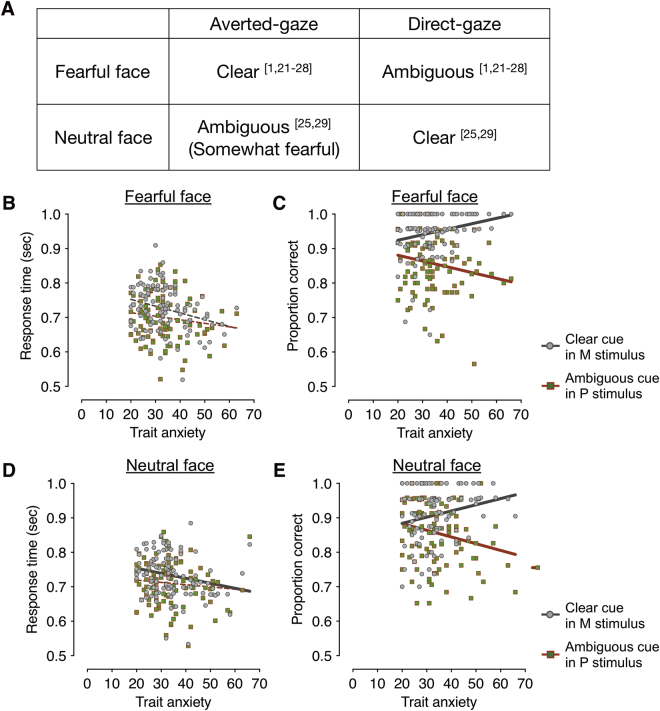
Figure 2.
The behavioral results from the main experiment. (A) Different combinations of facial expressions (fearful and neutral) and eye gaze (averted and direct) that convey clear and ambiguous cues. Numerical superscripts indicate relevant references. (B) The response time (RT) for clear fear (averted-gaze fear) faces presented in M-biased (dots in gray) and for ambiguous fear (direct-gaze fear) faces presented in P-biased (dots in red-green) stimuli. The gray and red lines indicate the linear relationship between trait anxiety and the RT for the M-biased stimuli and the P-biased stimuli, respectively. Solid, thicker lines indicate significant correlations (FDR adjusted p < 0.05), whereas broken, thinner lines indicate correlations that were not statistically significant. (C) The accuracy for clear fear (averted-gaze fear) faces presented in M-biased (dots in gray) and for ambiguous fear (direct-gaze fear) faces presented in P-biased (dots in red-green) stimuli. Solid, thicker lines indicate significant correlations (FDR adjusted p < 0.05), whereas broken, thinner lines indicate correlations that were not statistically significant. (D) The response time (RT) for clear neutral (direct-gaze neutral) faces presented in M-biased (dots in gray) and for ambiguous neutral (averted-gaze neutral) faces presented in P-biased (dots in red-green) stimuli. Note that the type of eye gaze that is combined to neutral face for clear cue is different from fearful face. (E) The accuracy for clear neutral (direct-gaze neutral) faces presented in M-biased and for ambiguous neutral (averted-gaze neutral) faces presented in P-biased stimuli.

