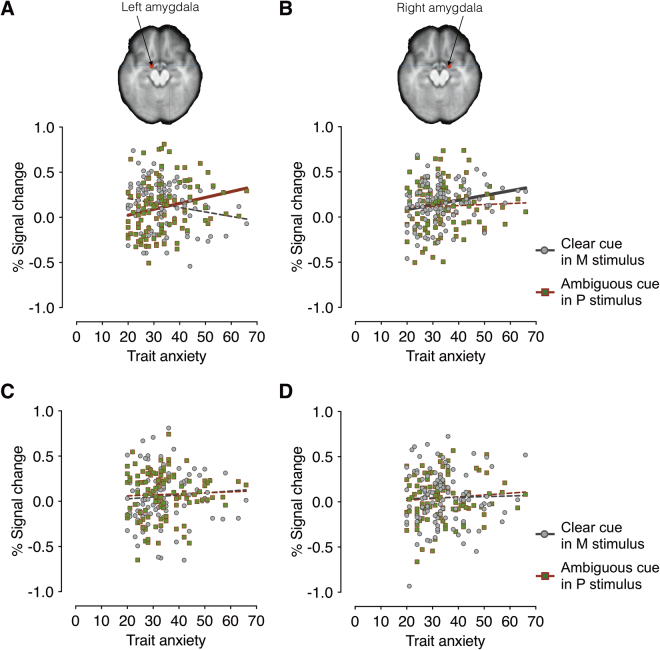
Figure 4.
The left and right amygdala activation during perception of fearful (A and B) and neutral faces (C and D). (A) The scatter plot of the trait anxiety and the % signal change in the left amygdala when participants viewed clear fear (averted-gaze fear) faces presented in M-biased (in gray dots) and ambiguous fear (direct-gaze fear) faces in P-biased (in red-green dots) stimuli. The gray and red lines indicate the linear relationship between trait anxiety and the left amygdala activation for the M-biased stimuli and the P-biased stimuli, respectively. The solid, thicker lines indicate statistically significant correlations (FDR adjusted p < 0.05), whereas broken, thinner lines indicate that correlations were not statistically significant. (B) The scatter plot of the trait anxiety and the % signal change in the left amygdala when participants viewed clear fear (averted-gaze fear) faces presented in M-biased (in gray dots) and ambiguous fear (direct-gaze fear) faces presented in P-biased (in red-green dots) stimuli. (C) The scatter plot of the trait anxiety and the % signal change in the left amygdala when participants viewed clear neutral (direct-gaze neutral) faces presented in M-biased (in gray dots) and ambiguous neutral (averted-gaze neutral) faces presented in P-biased (in red-green dots) stimuli. (D) The scatter plot of the trait anxiety and the % signal change in the right amygdala when participants viewed clear neutral (direct-gaze neutral) faces presented in M-biased (in gray dots) and ambiguous neutral (averted-gaze neutral) faces presented in P-biased (in red-green dots) stimuli.

