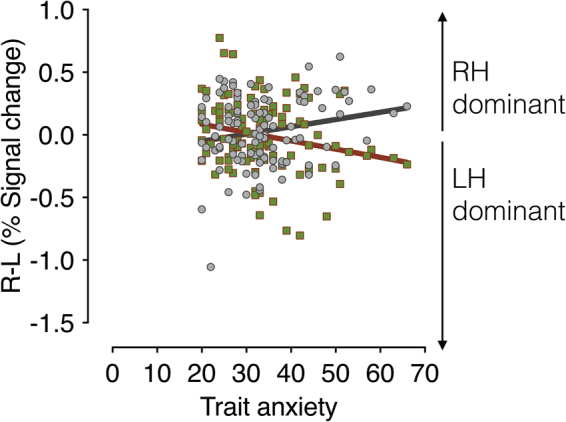
Figure 5.

The magnitude of hemispheric lateralization in amygdala, obtained by subtracting the % signal change in the left amygdala from that in the right amygdala for each participant. The magnitude of hemispheric lateralization in amygdala when participants viewed clear fear (averted-gaze fear) faces presented in M-biased (dots in gray) and ambiguous fear (direct-gaze fear) faces presented in P-biased (dots in red-green) are plotted as a function of observers’ trait anxiety. The positive values indicate greater activation in the right amygdala (right hemisphere (RH) dominant) whereas the negative values indicate greater activation in the left amygdala (left hemisphere (LH) dominant). The gray and red lines indicate the linear regressions with trait anxiety for the M-biased and P-biased stimuli, respectively. Solid, thick lines indicate that correlations were statistically significant (FDR adjusted p < 0.05).
