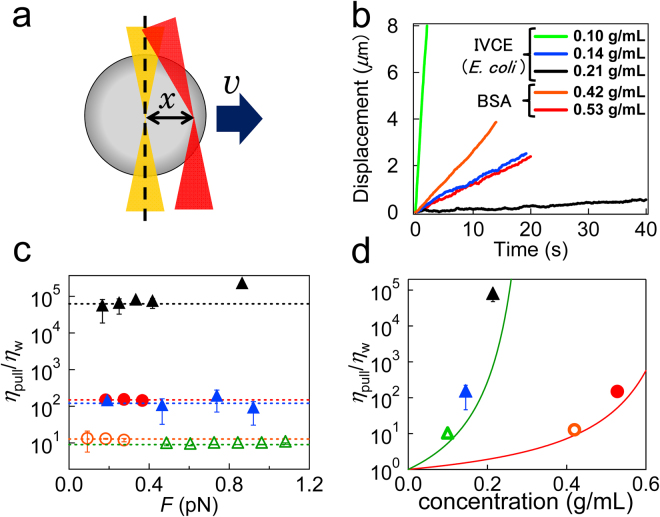
Figure 2.
Bead-pulling MR in force clamp mode. (a) A schematic of the particle-pulling experiment. A constant force was applied to the probe by maintaining a constant distance x between the probe center and laser focus. Resulting velocity v yields viscosity η. (b) The relation between the time and displacement in cell extracts prepared from E. coli at various concentrations [0.10 g/mL pulled by 0.25 pN (green), 0.14 g/mL by 0.19 pN (blue), and 0.21 g/mL by 0.14 pN (black)] and in BSA solutions [BSA 0.42 g/mL pulled by 0.18 pN (orange), and BSA 0.53 g/mL pulled by 0.18 pN (red)]. (c) The dependence of the applied pulling force on relative viscosity η/η w in BSA solutions (orange circles: 0.42 g/mL, and red filled circles: 0.53 g/mL) and in E. coli cell extracts (green triangles: 0.10 g/mL, blue filled triangles: 0.14 g/mL, and black filled triangles: 0.21 g/mL). (d) η pull of BSA solutions and IVCEs (E. coli) evaluated by particle pulling are plotted together with η estimated from PMR (solid curves).

