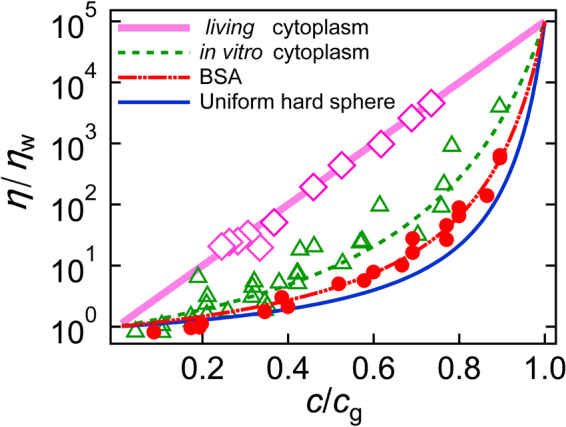
Figure 3.

Angell plots. Relative viscosity η/η w as a function of scaled concentration c/c g for BSA (red circles and the dash-dot-dot curve), for cell extracts from E. coli (green triangles and the dotted curve), and for cytoplasm in a living cell (pink diamonds and the solid line). Curves are the fits of Equation (1); c g for each sample was determined as a concentration where η/η w becomes 10 5-fold greater than that in water. The solid curve represents the results reported in refs31,39 for the suspension of hard-sphere colloids of uniform size. The solid line indicates Arrhenius behavior for strong glass to which viscosity in living cells conforms.
