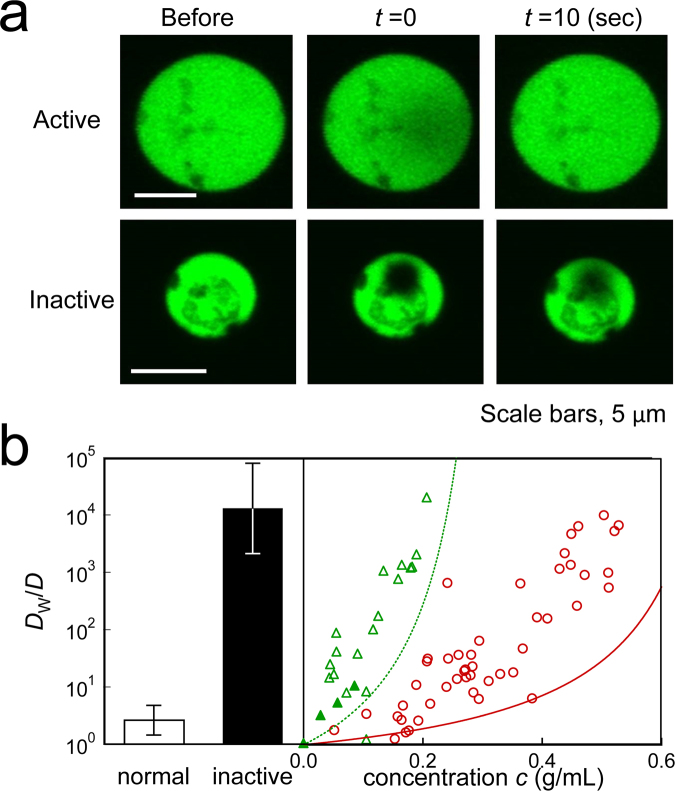
Figure 4.
Diffusion in living cytoplasm and in vitro cytoplasm measured by FRAP. (a) Fluorescent images of GFP-labeled living spheroplasts of E. coli before, immediately after (t = 0 s), and 10 s after photobleaching. The photobleached region in a metabolically inactive spheroplast remained dark even at 10 s after photobleaching (lower panels), whereas the dark region was obscured already at t = 0 in normal spheroplasts (upper panels) because of rapid transport. (b) Inverse of diffusion coefficients D of GFP in IVCEs/liposomes (open triangles), IVCEs/emulsions (filled triangles) and BSA/liposomes (circles) measured with FRAP. These data were normalized to the value in water as D w/D. The broken and solid curves indicate η/η w in IVCEs and BSA solutions which are measured by PMR (same lines with that in Fig. 1), respectively. D w/D of GFP in normal (white bar) and metabolically inactive spheroplast cells (black bar) are also shown.

