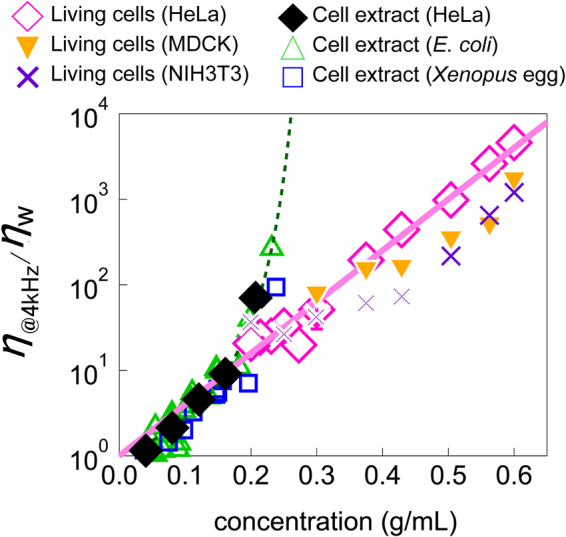
Figure 5.

Concentration dependence of viscosities at 4 kHz in living cells and in cell extracts. η @4kHz/η w for cell extracts (green triangles: E. coli, blue squares: Xenopus eggs, black diamonds: HeLa cells) and for cells (pink diamonds: HeLa cells, filled orange downward triangles: MDCK cells, purple crosses: NIH3T3 cells). The green solid line represents fit of Equation (1) to η ext@4kHz/η w measured by PMR. A solid pink line is the exponential fit for cell extracts at low concentration and living cells.
