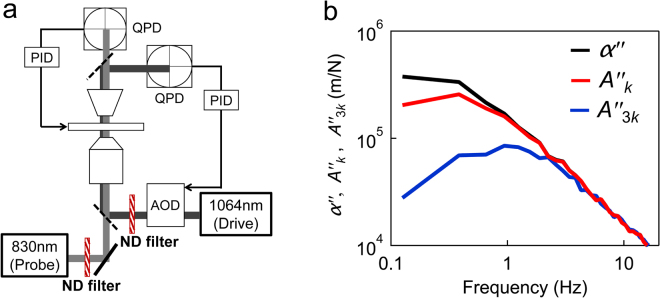
Figure 6.
The microrheology setup and trapping-force calibration. (a) A simplified schematic of the experimental setup. A constant trapping force was applied by rapidly steering the position of the drive laser (λ = 1064 nm) using the feedback-controlled AOD (force clamp). Displacements of the probe were detected using a fixed probe laser (λ = 830 nm). In the bead-pulling experiments, the piezo stage was also feedback controlled in order to eliminate the probe drift. (b) Imaginary parts of the response functions, A k (red curve), A 3k (blue curve), and α (black curve), measured in BSA solution (0.54 g/mL). Full complex responses including real parts are shown in Supplementary Fig. S10. With the increase of trap stiffness, the responses were suppressed at low frequencies.

