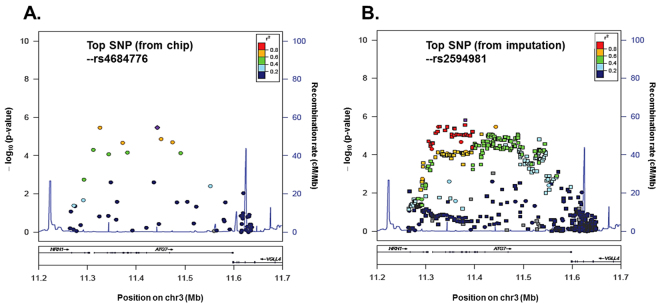
Figure 3.
Association plots for the ATG7 locus. Regional association plot for the ATG7 locus on chromosome 3 (A) with gene annotations superimposed. Each SNP is plotted with respect to its chromosomal location (x-axis) and its −log10 P values (left y-axis) for the trend test from the primary GWAS scan at that region of the chromosome. After imputation (B), squares represent imputed SNPs, and circles represent genotyped SNPs. Colors denote the strength of the linkage disequilibrium of the SNPs to ATG7.

