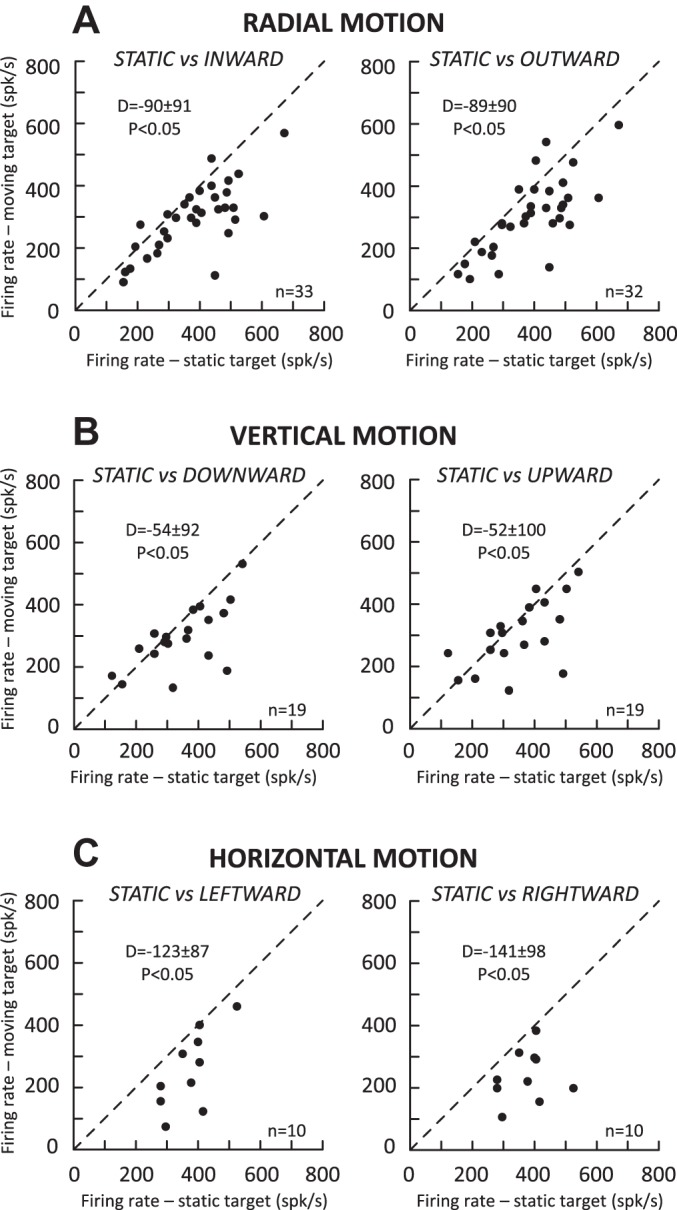
Fig. 10.

Comparison of the average firing rate (at MF preferred amplitude) of the motor burst between saccades toward a static target (x-axis) and saccades toward a target (y-axis) moving along the radial axis (A), the vertical axis (B), and the horizontal axis passing through the preferred amplitude (C). Each dot corresponds to the measurement provided by spline fitting the amplitude tuning curves for each neuron when this was possible (see Data set and analysis). In each graph, the mean and SD of differences (D values) and the statistical significance of their comparison with the Wilcoxon test are documented.
