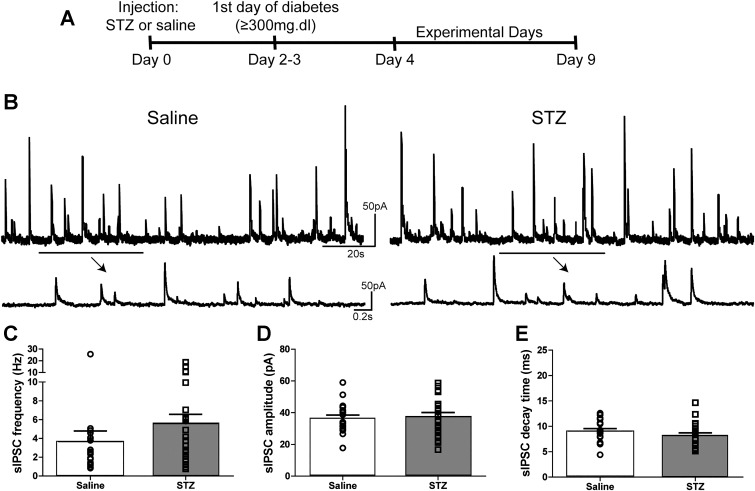
Fig. 1.
sIPSC parameters in DMV neurons from mice with STZ-induced diabetes. A: experimental timeline. B: representative traces showing sIPSCs in DMV neurons from saline (left)- and STZ-treated mice (right) in the presence of elevated GABA concentration ([GABA]; either 3 μM GABA or 1 mM NIP). Arrows indicate temporally expanded sections of the trace above. C: mean sIPSC frequency comparison between neurons from saline (n = 20)- and STZ-treated mice (n = 21) in the presence of elevated [GABA], with individual neuronal frequencies overlaid. D: mean sIPSC amplitude comparison between neurons from saline- and STZ-treated mice in the presence of elevated [GABA] with individual neuronal amplitudes overlaid. E: mean sIPSC decay time constant in neurons from saline- and STZ-treated mice in the presence of elevated [GABA] with individual neuronal amplitudes overlaid. No statistical differences were observed for any of these measures (P > 0.05); all solutions contained kynurenic acid (1 mM).

