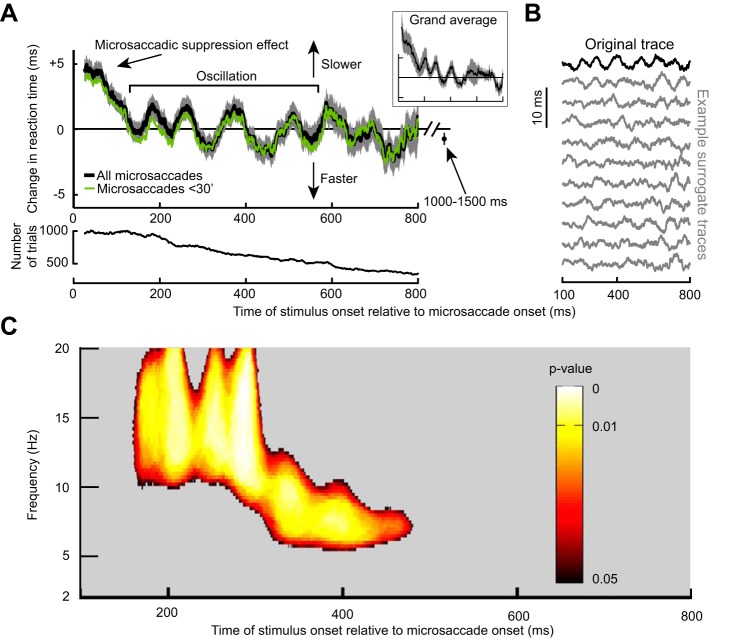
Fig. 3.
Long-term microsaccadic influence on RT. A: change in mean RT as a function of target onset time relative to a microsaccade. This trace shows the demeaned RT trace before detrending (see materials and methods). After an initial ~100-ms period of RT costs (i.e., increases) due to “microsaccadic suppression,” RT oscillated coherently for almost 600 ms. Error bars denote SE across all trials from all subjects combined (see materials and methods), and we used a running window of 50 ms (in steps of 1 ms); the inset shows that we obtained very similar RT fluctuations when individual subject data were first averaged into a single subject trace and then all the single subject traces averaged together to obtain a grand average. The bottom shows the number of trials used per time bin in the top and using the same running window procedure. Also, the green trace shows results from only trials with microsaccades less than a 30-min arc in amplitude. Note that the RT oscillation (and subsequent measurement for 1,000–1,500 ms shown as an individual data point) hovered slightly below 0. This is because the total average used to demean RT included all trials even those with target onset <300 ms from fixation spot onset; because these early trials almost always had a microsaccade (e.g., Fig. 4C), they had long RTs due to microsaccadic suppression, and this elevated the average RT value slightly. B: the top trace in black is the original demeaned and detrended RT trace from the same data in A. Below this trace are 10 example surrogate traces according to the permutation procedures of Fig. 2A. Our goal was to establish statistically whether oscillations in the original trace that are visible by inspection were not ones expected by chance as might happen in some of the surrogate traces. C: power spectrum of the trace in A during the interval following the initial microsaccadic suppression period of 100 ms. Colored pixels indicate times and frequency bands with a significant oscillation that is not expected by chance from the surrogate traces (Fig. 2; see materials and methods).

