Fig. 7.

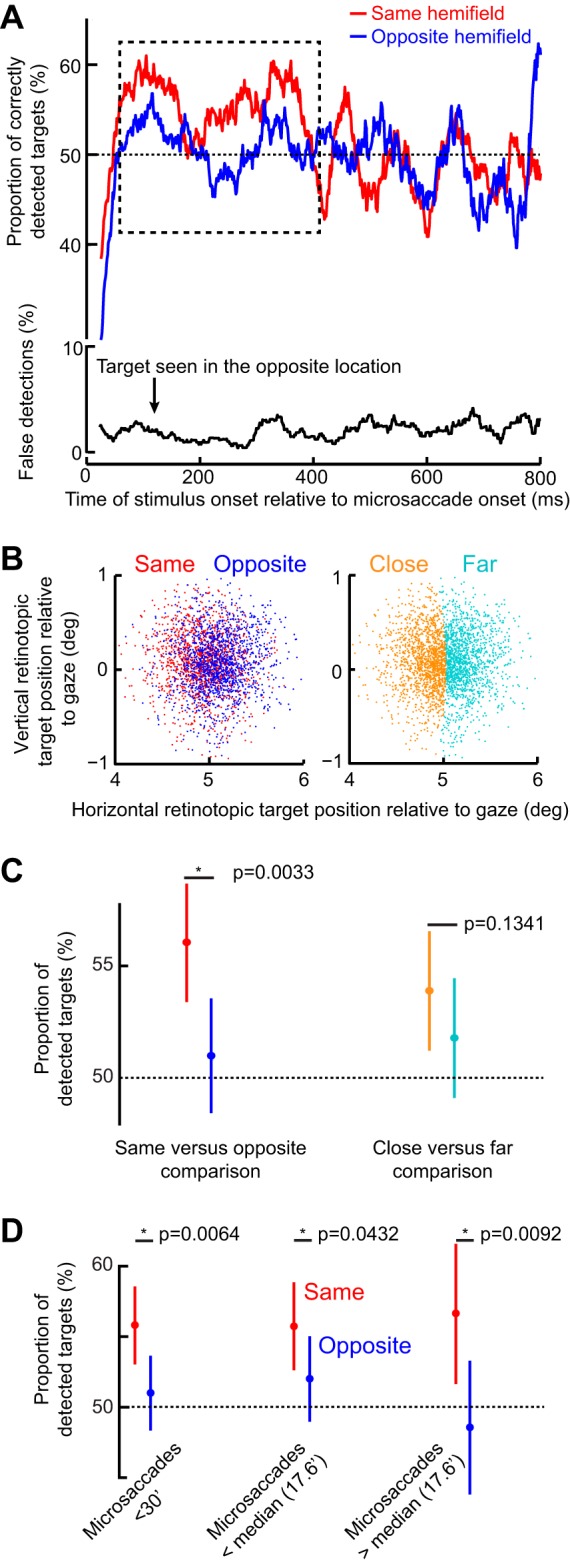
Same-hemifield advantage in detectability during the period of the initial RT pulse. A, top: mean detectability (i.e., correct responses) as a function of time after microsaccade onset. Immediately after microsaccades, detectability was impaired, consistent with microsaccadic suppression effects (see materials and methods). However, in the dashed rectangle, which corresponds closely with the same-hemifield RT pulse in Fig. 5, A and C, detectability was significantly higher for targets appearing in the same hemifield as a microsaccade than for opposite targets (P = 0.0033; 2-proportion z-test). A, bottom: incorrect target localizations, which were rare and unmodulated by microsaccadic suppression, suggesting that subjects followed task instructions (also see results). B: retinotopic target position at the time of target onset for trials in the early (100–400 ms) interval after microsaccade onset (each dot is a trial). Positions are colored based on the direction of the last microsaccade relative to the target (left) or whether the target was closer or farther than the median Euclidean distance observed. C: mean detectability during the early (100–400 ms) period. The left pair compares conditions when the target was presented in the same or opposite hemifield relative to a microsaccade. The right pair compares closer or farther targets from the fovea. Detectability was only enhanced in the same hemifield condition (left) and did not depend on retinotopic target position (right). D: mean detectability as in C but now only when microsaccades were less than a 30-min arc in amplitude or when they were smaller or bigger than the median. In all cases, the same-hemifield advantage of A was observed. Error bars denote 95% confidence intervals.
