Fig. 3.
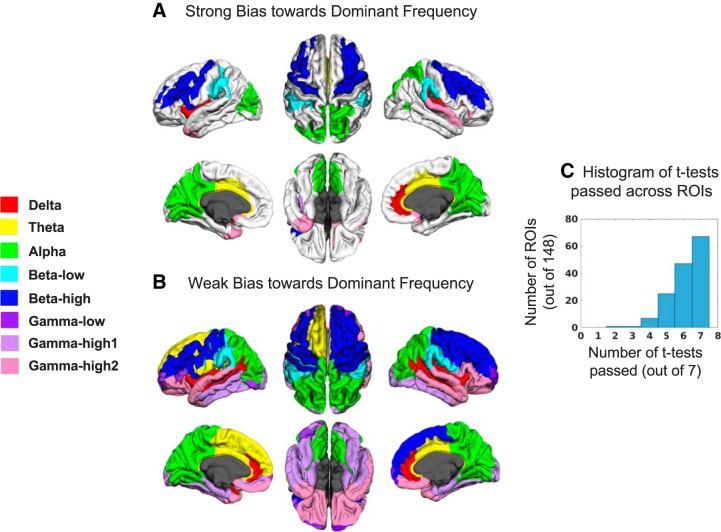
Dominant frequency maps. A: cortical regions showing a strong bias (defined as a frequency with maximal standardized power > standardized power of all other frequencies, P < 0.05, FDR corrected) toward the dominant frequency. Dominant frequency for an ROI is color coded according to the legend at left. B: cortical regions showing a weak bias (frequency with maximal standardized power > standardized power of at least one other frequency, P < 0.05, FDR corrected) toward the dominant frequency. C: for each ROI, 7 post hoc paired, one-sided t-tests were performed to compare frequencies. The histogram shows the number of ROIs passing the stated number of t-tests. Only about half of the ROIs show a strong bias (all 7 tests passed at α < 0.05, FDR corrected), suggesting many regions do not have strong timescale biases.

