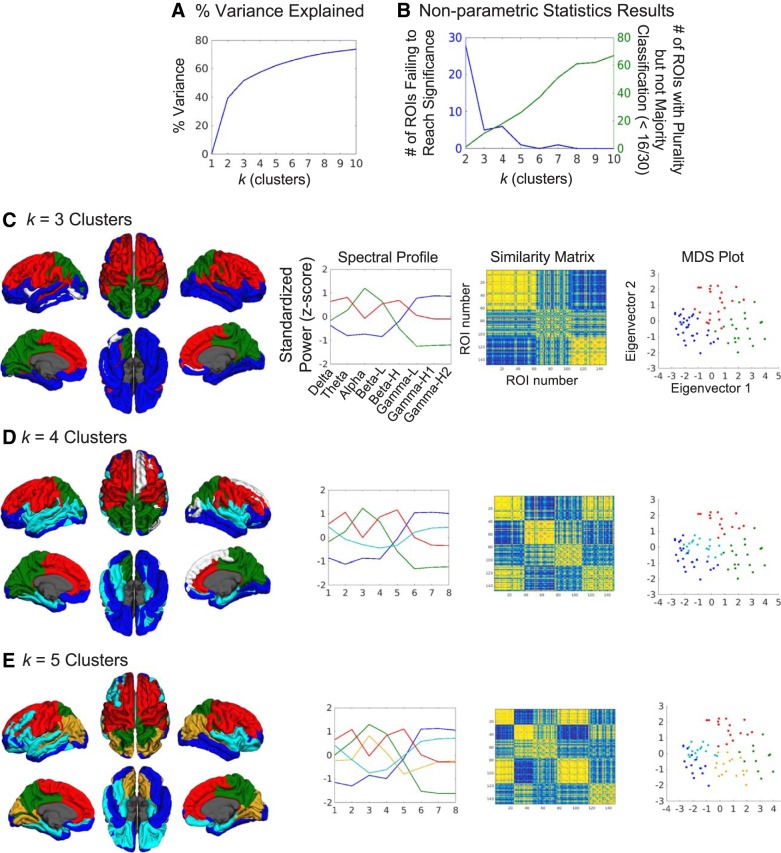
Fig. 4.
Clustering reveals several spectral profiles across the cortex. A: ROIs were clustered by spectral features using K-means analysis for k = 2 through 10 clusters. The percent variance explained by each cluster solution is graphed. B: nonparametric statistics demonstrated clustering consistency across subjects (i.e., whether each ROI consistently assigned the same cluster spectral profile across all subjects). The blue line in the graph plots the number of ROIs that were not consistently clustered for each solution of k. The green line plots the number of ROIs that were consistently clustered across subjects but have a plurality (largest subset), not a majority, of subjects picking the same spectral profile for a given ROI. As k increases, the number of possible clusters assigned to an ROI increases, making it harder to achieve a majority of at least 16/30 subjects. Both graphs helped us determine that k = 3, 4, and 5 were solutions fitting a good trade-off of model reliability and complexity. C: cortical maps of the k = 3 cluster solution (first column) where colors index the spectral profiles (second column). White ROIs on cortical surface maps did not pass the permutation test after FDR correction. The similarity matrix (third column) shows reasonably tight clustering across the 3 clusters. The multidimensional scaling (MDS) plot of ROIs (fourth column) also demonstrates tight clustering with this solution. D: the k = 4 cluster solution. E: the k = 5 cluster solution.

