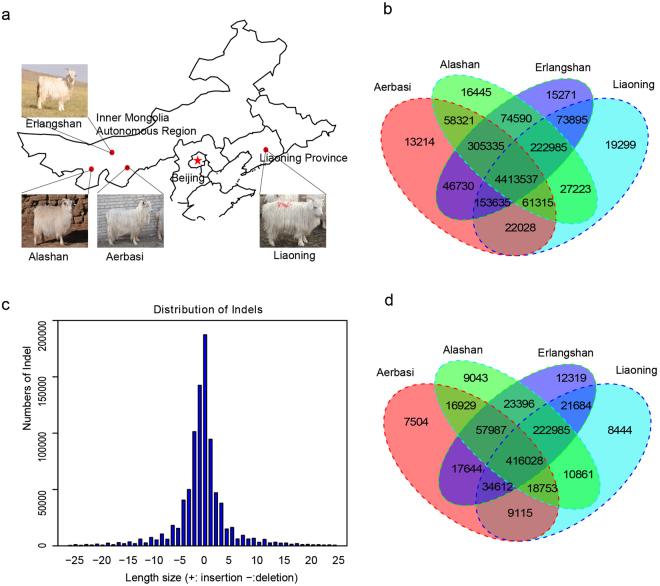
Figure 1.
Summary of cashmere goats. (a) Geographic map indicating the distribution of the cashmere goats sampled in this study (Photographs were taken by Rui Su and Xiaokai Li). Each red dot represents the location of sampling. The map was generated using the ‘ggmap’ package in R (version 3.4.1) (https://cran.r-project.org/)60,61 and trimmed by Adobe Photoshop CS6 (http://www.adobe.com/). (b) Venn diagram of SNVs shows the overlap and population-specific identified SNVs among four cashmere goat populations. (c) Distribution of InDels. The length of each bar represents the number of InDels. (d) Venn diagram of InDels show the common and population-specific genetic variants among four cashmere goat populations.

