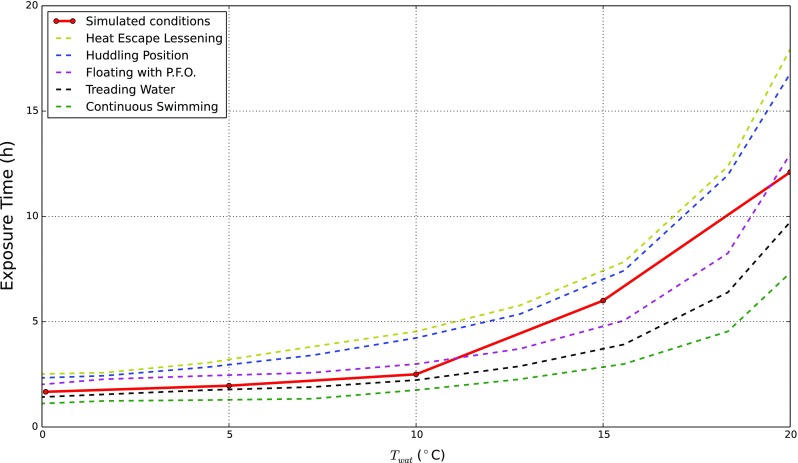
Fig. 3.

Hypothermia - median lethal exposure. The chart shows the time necessary to develop lethal hypothermia for different swimming water conditions. Dashed lines are generated from the experimental measurements given by [26]. The dark red line is built on five different simulation results
