
Fig. 6.
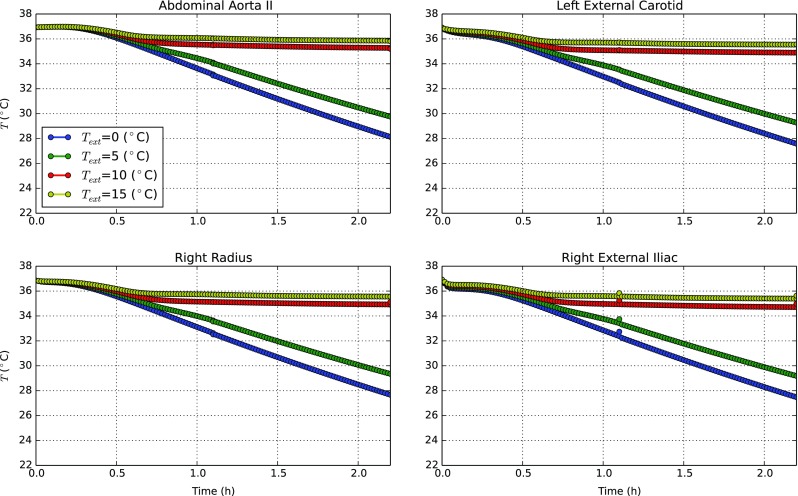
The blood temperature distribution at various blood monitoring points when exposed to water at different T wat
Official websites use .gov
A
.gov website belongs to an official
government organization in the United States.
Secure .gov websites use HTTPS
A lock (
) or https:// means you've safely
connected to the .gov website. Share sensitive
information only on official, secure websites.
The blood temperature distribution at various blood monitoring points when exposed to water at different T wat