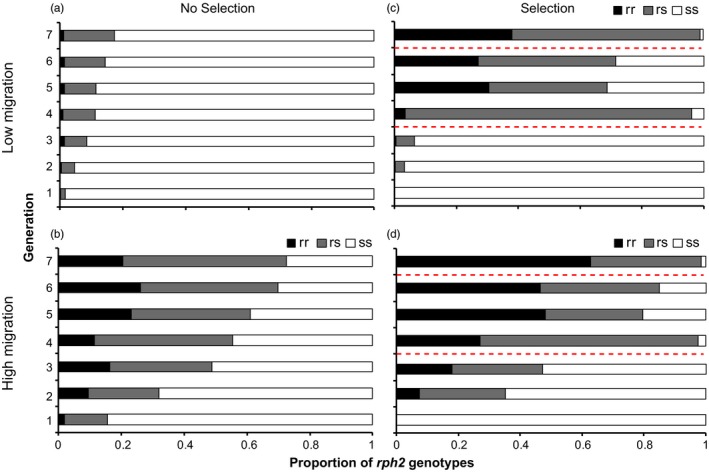
Figure 3.

Proportions of rph2 genotypes in each of seven generations of Tribolium castaneum beetles for (a) no selection treatment, low migration rate; (b) no selection treatment, high migration rate; (c) selection treatment, low migration rate; and (d) selection treatment, high migration rate (n = 5 replicates in each treatment). Black bars represent the rph2 rr genotype, grey bars the rph2 rs genotype and white bars the rph2 ss genotype. The dashed red lines represent PH 3 fumigation
