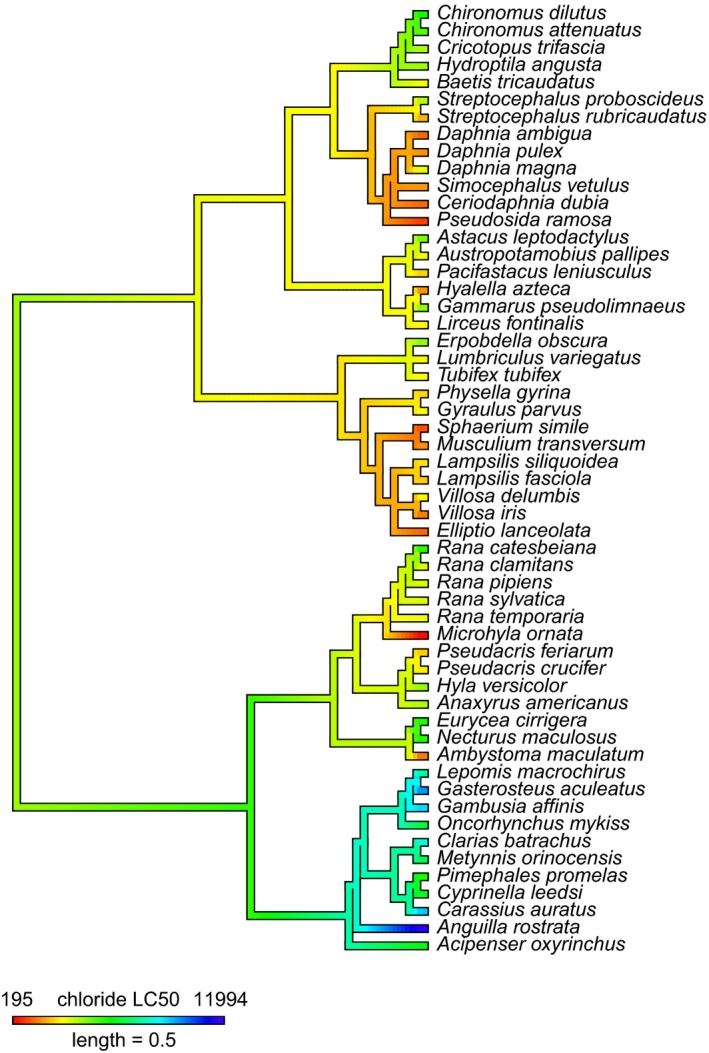
Figure 1.

Chloride LC50 mapped to a phylogeny of freshwater organisms. A phylogenetic tree queried from the Open Tree of Life is shown. Mean chloride LC50 values (mg/L) for each species are mapped to the tree. LC50 values are color coded, with values indicated in the legend
