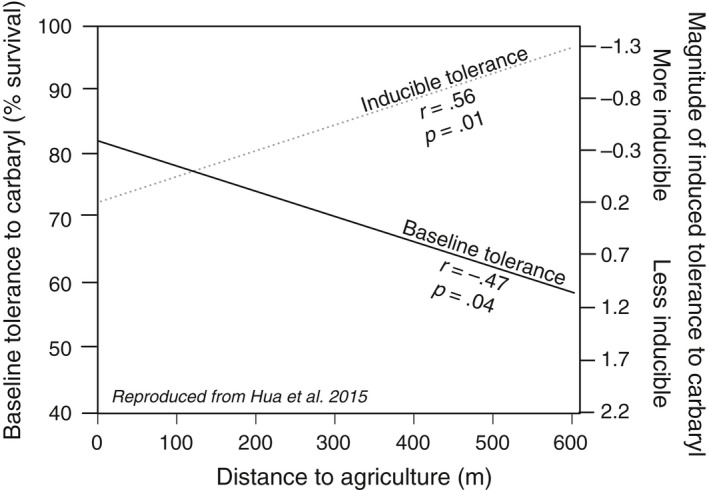
Figure 1.

The relationship between distance to agriculture, magnitude of baseline tolerance, and magnitude of inducible tolerance to carbaryl. Regression lines are reproduced using data from Hua et al. (2015). Distance to agriculture (m) was calculated as the shortest distance from collection location to an agricultural field. The measure of baseline tolerance was calculated as the percent survival following exposure to a lethal concentration of carbaryl. The measure of inducible tolerance is represented by the hazard regression coefficient (more negative values indicate populations with higher plasticity to pesticides). Exact values are reported Table 1
