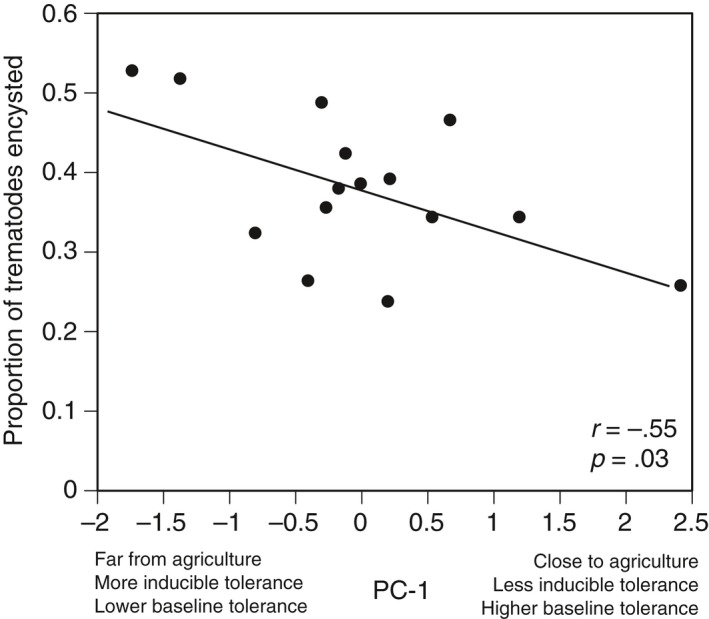
Figure 2.

The relationship between PC‐1 and the average proportion of trematodes encysted in wood frog tadpoles from 15 populations (r represents the correlation coefficient). To create PC‐1, we reduced our three variables (distance to agriculture, magnitude of baseline tolerance, and magnitude of inducible tolerance) into a single predictor (PC‐1). Each point represents the average proportion of trematodes that successfully encysted in tadpoles from a population
