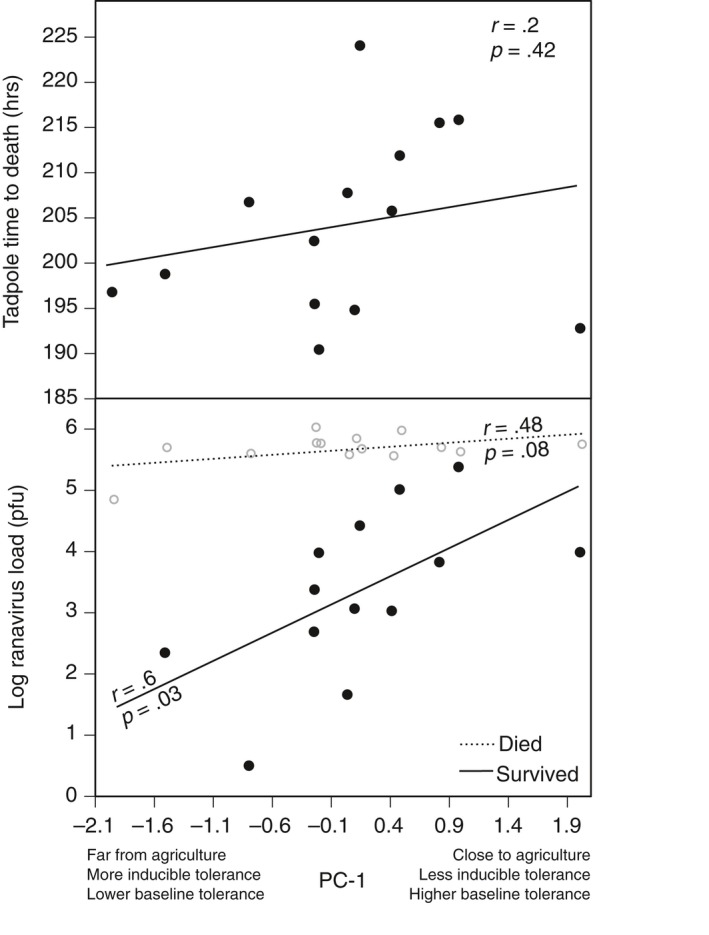
Figure 3.

The relationship between PC‐1 and average tadpole time to death (top panel) and PC‐1 and ranavirus load (log‐transformed; bottom panel) for infected wood frog tadpoles that survived (solid line) and died (dotted line) from 14 populations (r represents the correlation coefficient). To create PC‐1, we reduced our three variables (distance to agriculture, magnitude of baseline tolerance, and magnitude of inducible tolerance) into a single predictor (PC‐1). Each point represents the average log‐transformed viral load of all individuals from a population
