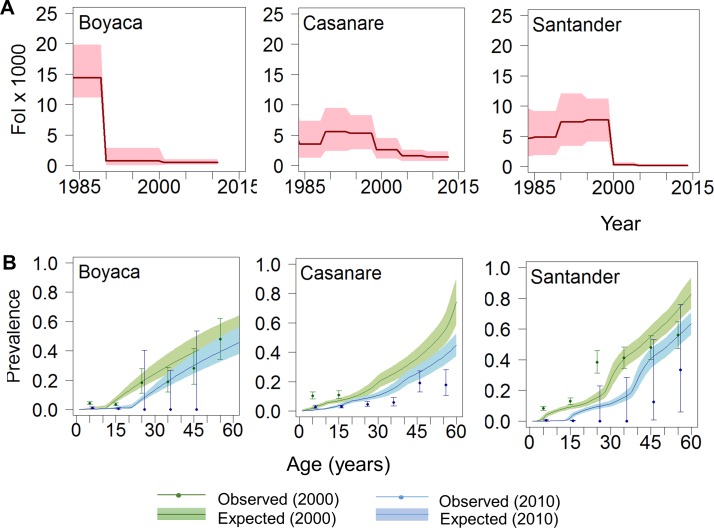
Figure 4.
Temporal trends in the force-of-infection (FoI) and age-prevalence profiles of Chagas disease in Colombia at subnational level in three of the most endemic departments. (A) FoI per 1000 population at-risk per year vs year for the period 1984–2014. Red solid lines represent median FoI and pink shaded areas the 95% Bayesian Credible Intervals (95% BCI) according to best-fit models. (B) Age profiles of Chagas disease seroprevalence for 2000 (green) and 2010 (blue). Coloured solid lines represent median predicted prevalence and coloured shaded areas the 95% BCI; solid circles represent observed prevalence values (plotted for the midpoint of each 5-year age range) and error bars are exact 95% CI. Panels from left to right correspond to Boyacá (model 2), Casanare (model 3) and Santander (model 3).

