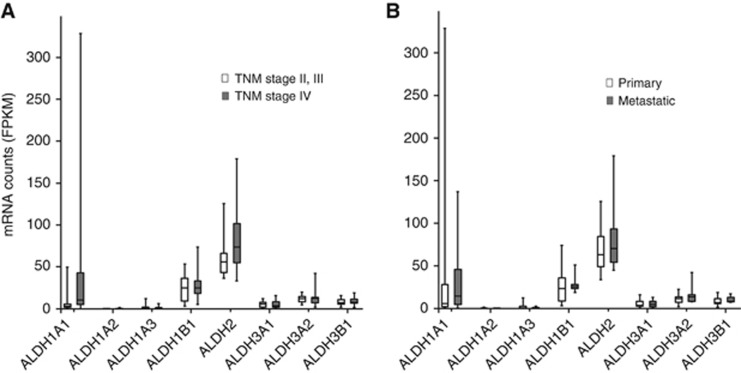
Figure 1.
ALDH mRNA levels in human CRC tissue samples by RNA sequencing. (A) Messenger RNA expression levels according to TNM classification. TNM stage II or III (white boxes, n=9) and IV (grey boxes, n=17). (B) Messenger RNA expression levels according to primary tumours (white boxes, n=18) or metastases (grey boxes, n=8). Bottom and top of each box represents the first and third quartiles, respectively. Horizontal line in the box indicates the median. The ends of the whiskers are maximum and minimum values.

