Figure 3.
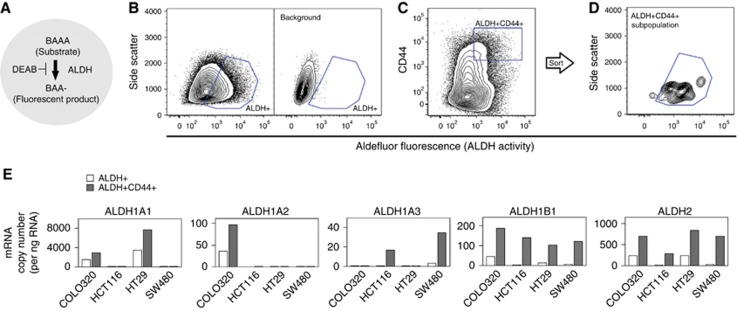
ALDH+CD44+ cells showed high expression of ALDH1B1 and ALDH2. (A) Schematic of Aldefluor system. The ALDH+ population was selected by its ability to metabolise aminoacetaldehyde. Fluorescent dye-modified aminoacetaldehyde (BAAA) was applied to cells in the presence or absence of ALDH inhibitor (DEAB). Cells that fluoresced in the presence of DEAB were excluded (background). (B–D) Selection of subpopulations. Representative two-parameter scatter plots of flow cytometry are shown for COLO320 DM cells. Blue box shows the selected population. (B) Selection of ALDH+ subpopulation. Right panel shows background fluorescence, that is, cells fluorescing in the presence of DEAB. (C and D) Selection of ALDH+CD44+ subpopulation. The ALDH+CD44+ subpopulation was selected from the whole population, that is, no background subtraction step was included (C). ALDH+CD44+ cells were post-tested with ALDH-SSC two-parameter histograms (confirmation of background exclusion) (D). (E) Aldehyde dehydrogenase isozyme mRNA levels in the subpopulations. Messenger RNA expression levels were measured in ALDH+ and ALDH+CD44+ subpopulations separated from the whole population on separate days. Data are the mean of three replicates. A full colour version of this figure is available at the British Journal of Cancer journal online.

