Figure 4.
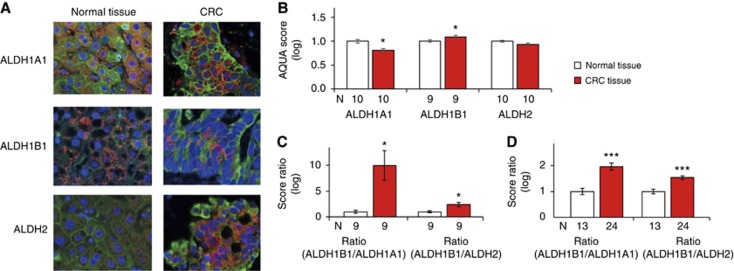
Fluorescent multiplexed analysis of ALDHs. (A) Representative histological images (magnification= × 400) of normal and CRC tissue. Blue: nuclei, green: cytokeratin, red: ALDH. (B) Automated quantitative analysis scores for ALDH1A1, ALDH1B1, and ALDH2 in matched pairs of normal and CRC tissue obtained from the same donors (*P<0.05, paired t-test). (C) Automated quantitative analysis score ratio of ALDH1B1 to ALDH1A1 or ALDH1B1 to ALDH2 in normal and CRC matched pairs of tissue (*P<0.05, paired t-test). (D) Ratio of ALDH1B1 to ALDH1A1 or ALDH1B1 to ALDH2 in normal and CRC tissue obtained from 24 donors (***P<0.0001, unpaired t-test). Data represent the mean±s.e.m. from N samples.

