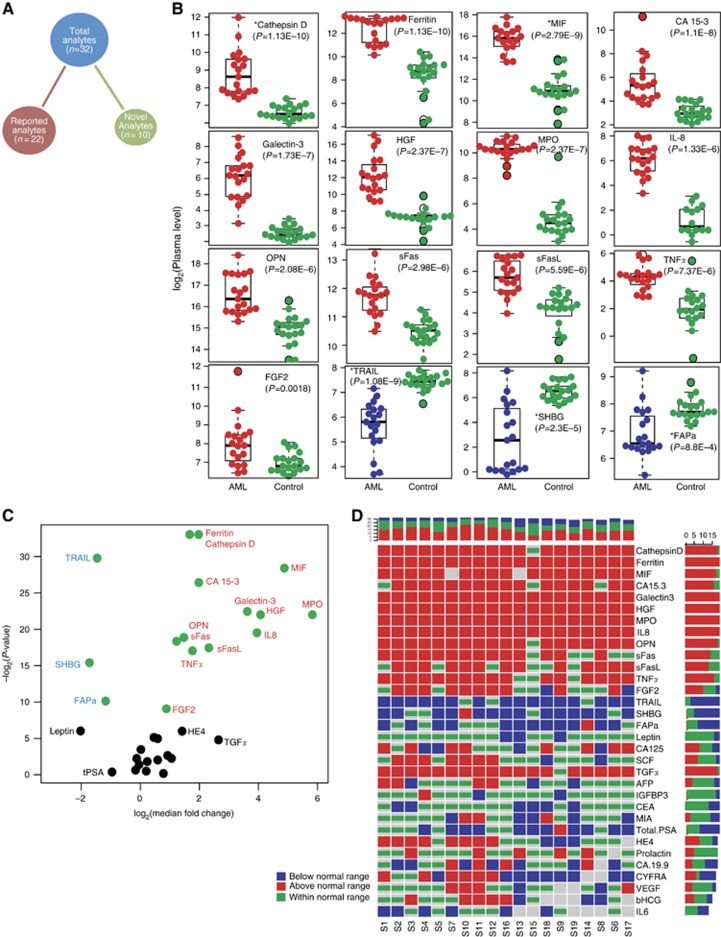
Figure 1.
Deregulated cytokines and small molecules in AML patients. (A) Distribution of the analytes. The total analytes (n=32) are divided into two sets: reported analytes (baselines reported previously in AML) and novel analytes (baselines have not been reported previously in AML). (B) Beeswarm plots of the 16 significantly deregulated (P<0.005, Mann–Whitney U-test) analytes in AML cases (red or blue colour) compared with healthy controls (green colour). Plots for the upregulated (red colour) and downregulated (blue colour) analytes are ordered based on the calculated P-value. Novel analytes are denoted by an asterisk (*). The y-axis shows plasma level in log2 scale. Nonsignificant analytes are shown in Supplementary Figure S1. (C) Volcano plot showing the relationship between median fold change (x-axis) and P-value of the Mann–Whitney U-test (y-axis). Positive values on the x-axis show upregulation, and negative values show downregulation. Green circles denote significantly deregulated (P<0.005) analyets. (D) Patient-specific aberrant expression of analytes. Columns denote the 19 studied AML patients and the 32 interrogated analytes are represented by rows. Horizontal and vertical sidebars summarise the distributions per analyte and patient, respectively. Red colour denotes upregulation, blue downregulation, and green no significant deregulation (within normal/healthy control range). Grey boxes denote missing values.

