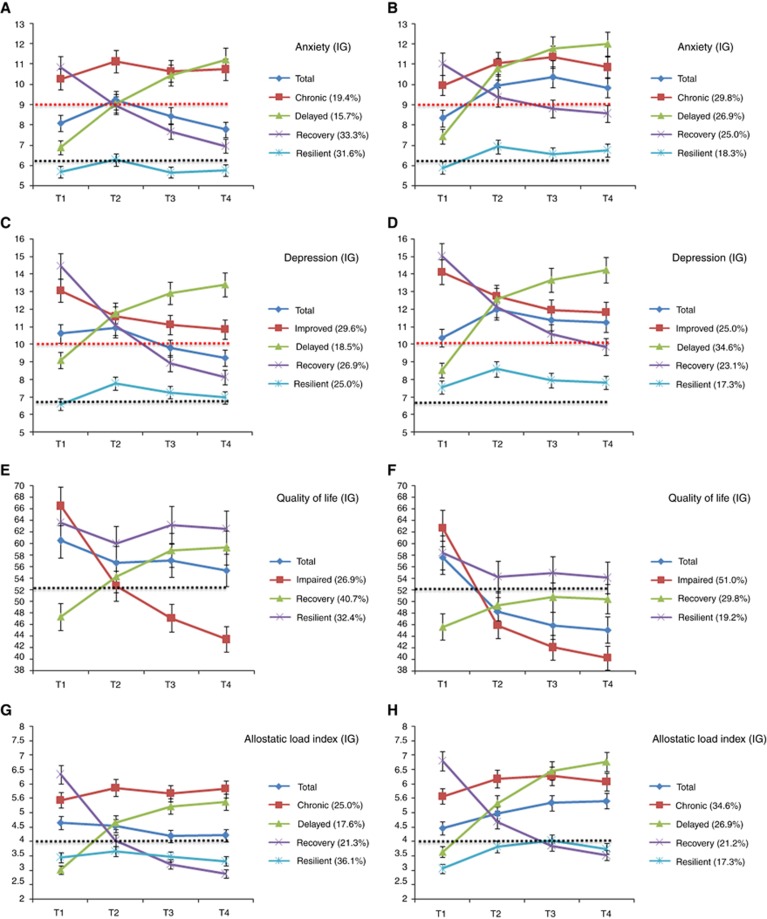
Figure 3.
Growth Mixture Model (GMM) for secondary outcomes between IG and CG. (A–D) Black dotted line indicates a sample of women without breast cancer from our previous study (Ye et al, 2016). Red dotted line indicates a sample with high risk for anxiety and depression symptoms. (E–H) Black dotted line indicates a sample of women with non-metastatic breast cancer from our previous study (Ye et al, 2016).

