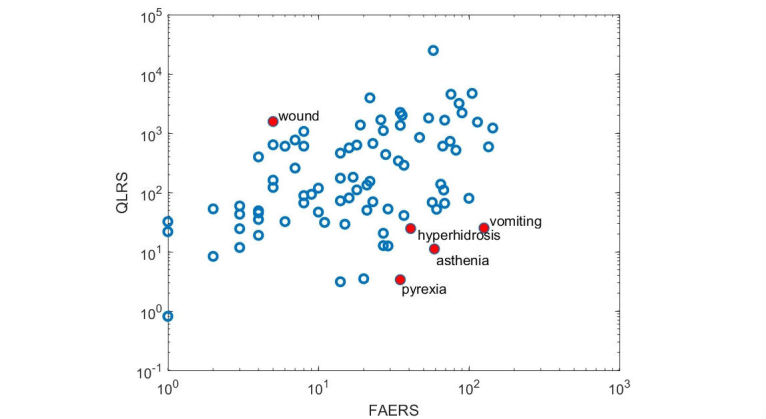
Figure 3.

Plotted Query Log Reaction Scores (QLRS) versus the number of reports in Food and Drug Administration's Adverse Drug Reporting System (FAERS). Each dot represents an adverse drug reaction. Axes are log-scaled. Full red dots denote outliers, as identified by the analysis. Correlation between FAERS counts and QLRS scores for the blue unfilled dots is .42 (P<.001).
