Figure 4.

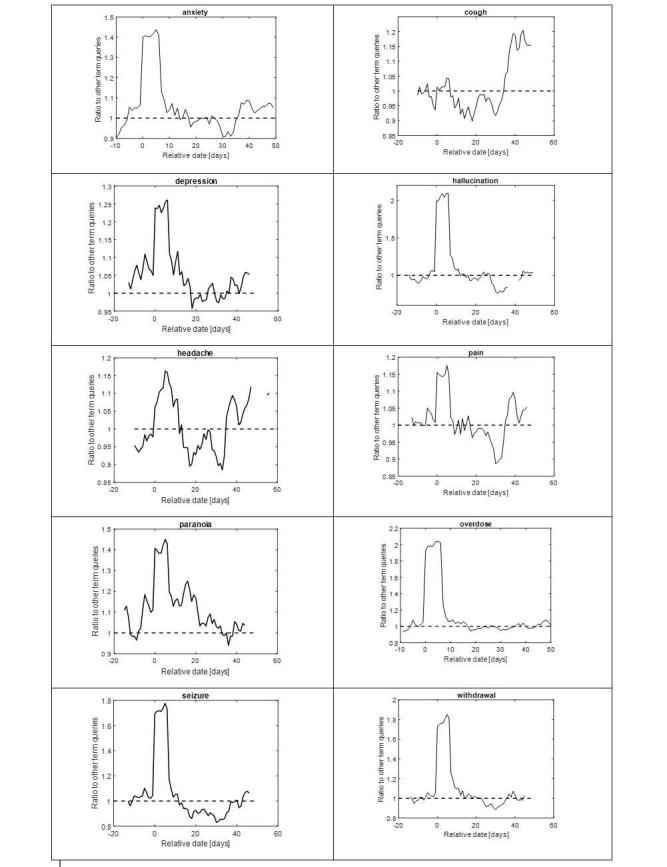
Temporal profiles of symptom queries (Day 0=first query for terms synonymous with "cannabis" and "marijuana"). Time series are smoothed with a 7-day moving average window. Shown are days with the 25% highest activity.

Temporal profiles of symptom queries (Day 0=first query for terms synonymous with "cannabis" and "marijuana"). Time series are smoothed with a 7-day moving average window. Shown are days with the 25% highest activity.