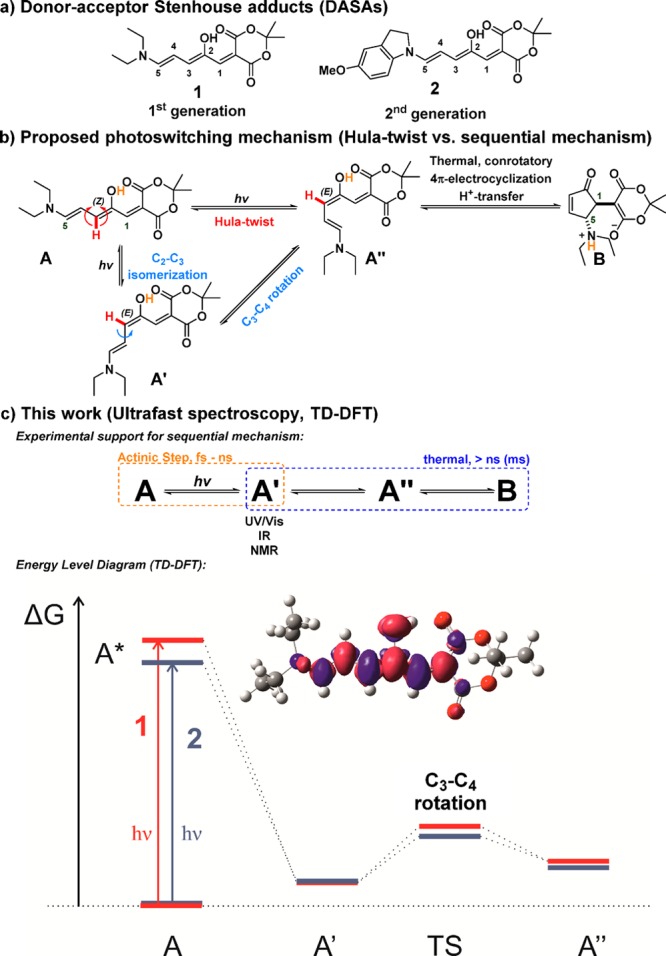
Figure 1.

Photoswitching of DASAs: (a) photoswitches used in this study; (b) refined mechanistic proposal; and (c) findings of this work. The red (blue) relative energy levels correspond to DASA 1 (2) (see SI sections 6.1 and 6.3). In the electron density differences plot, the blue (red) regions correspond to decrease (increase) in electron density upon electronic transition for DASA 1.
