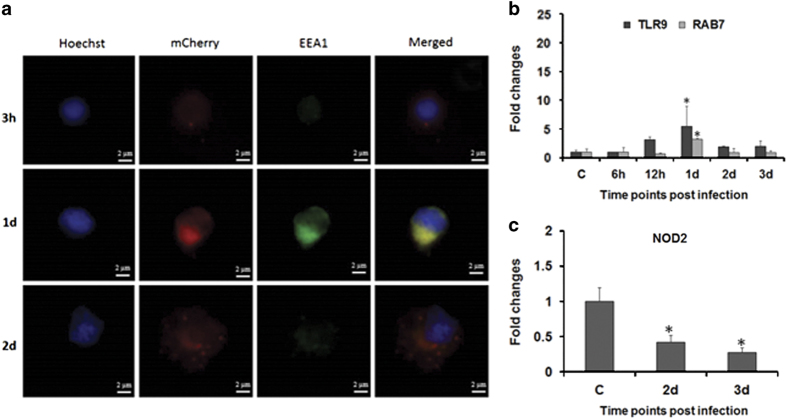
Figure 5.
A. hydrophila trafficking in zebrafish. (a) Zebrafish were infected with mCherry-tagged A. hydrophila. Bacterial localization was revealed by immunofluorescence staining of zSPM using Hoechst 33342 and EEA1 at indicated time points (×100). (b, c) Expression of TLR9, RAB7 and NOD2 was determined from spleen of control and infected fishes. Each bar represent the mean of three independent experiments (n=5/experiment) and the error bars represent the standard deviations. C, control; d, days; h, hours; zSPM, zebrafish splenic macrophages; and asterisks '∗' on bars indicate significant difference from control (P<0.05).

