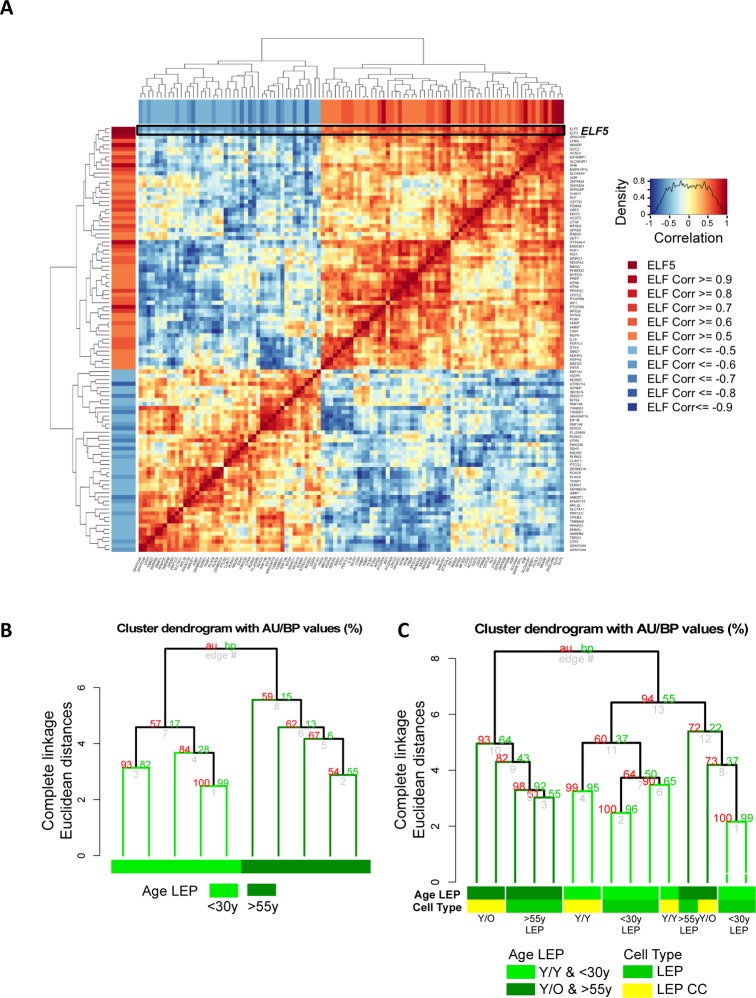
Figure 7. Microenvironment-imposed reduction of ELF5 causes an entire network of genes to change.
Age‐related changes in ELF5 are associated with age‐specific changes in ELF5‐target genes in the LEP lineage. (A) Gene‐gene correlation matrix of ELF5 (2 gene probes) and 92 ELF5‐target genes (103 gene probes) found to have absolute correlation ≥ 0.5 with ELF5 in LEP from <30y and >55y age groups across 9 HMEC strains. Annotated in both the row and column bars of the correlation matrix is each ELF5‐target gene probe's correlation value to the ELF5 probes. (B) Hierarchical clustering based on log2 expression levels of ELF5 and the anti‐/correlated ELF5‐target genes in <30y and >55y 4p pre-stasis LEP, (C) and in Y/Y (n=3) and Y/O (n=3) co‐cultures with <30y (n=5) and >55y (n=4) 4p LEP isogenic to the MEP strains used in co‐culture, using Euclidean distance measures and complete linkage. Percent Approximately Unbiased (AU) p-values denoted in red, and percent Bootstrap Probability (BP) in green are calculated and annotated above each cluster.

