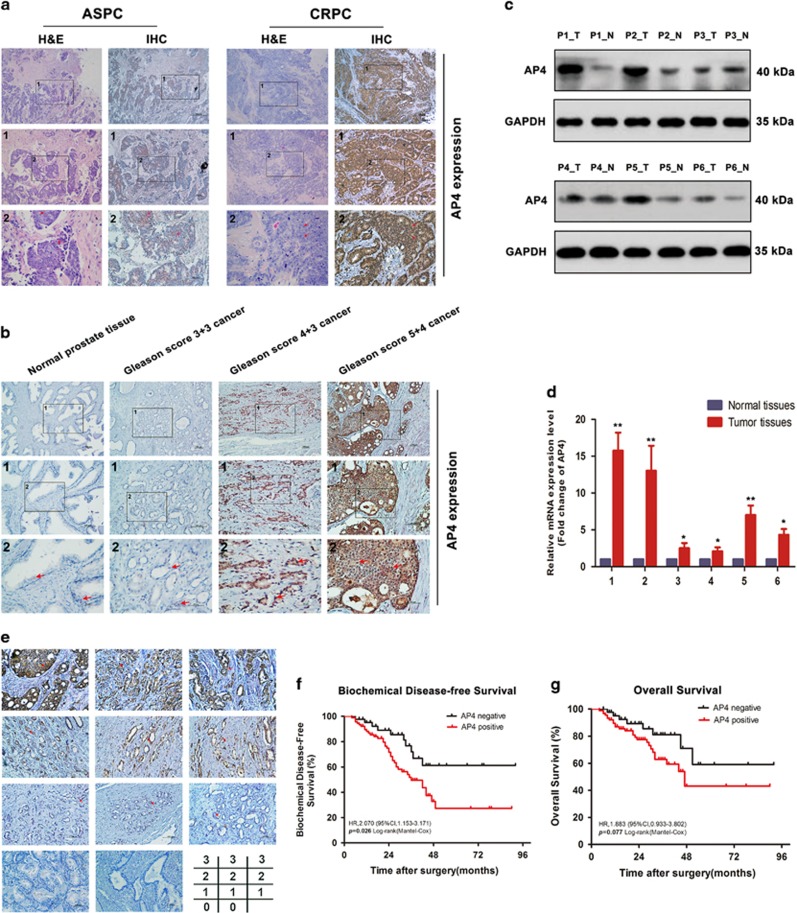
Figure 7.
Upregulation of AP4 correlated with poor prognosis in human CRPC. (a) Representative images of H&E and IHC in androgen-sensitive PCa (ASPC) and castration-resistant PCa (CRPC) (n=8) with different AP4 staining. (b) Representative images of AP4 staining in normal tissue, Gleason score 3+3, Gleason score 4+3 and Gleason score 5+4, respectively. (c,d) Western blot analyses and qRT-PCR of AP4 expression in PCa tissues (T) and matched adjacent non-tumour tissues (N). The mRNA and protein levels were normalized to GAPDH. (e) Representative images of AP4 staining in human PCa tissues (score 0–score 3). (f,g) Kaplan–Meier survival curves for bDFS and OS of PCa patients (n=133) with different AP4 staining scores (the score of 0 or 1 represented AP4 negative, while 2 or 3 represented AP4 positive)

