Figure 2.
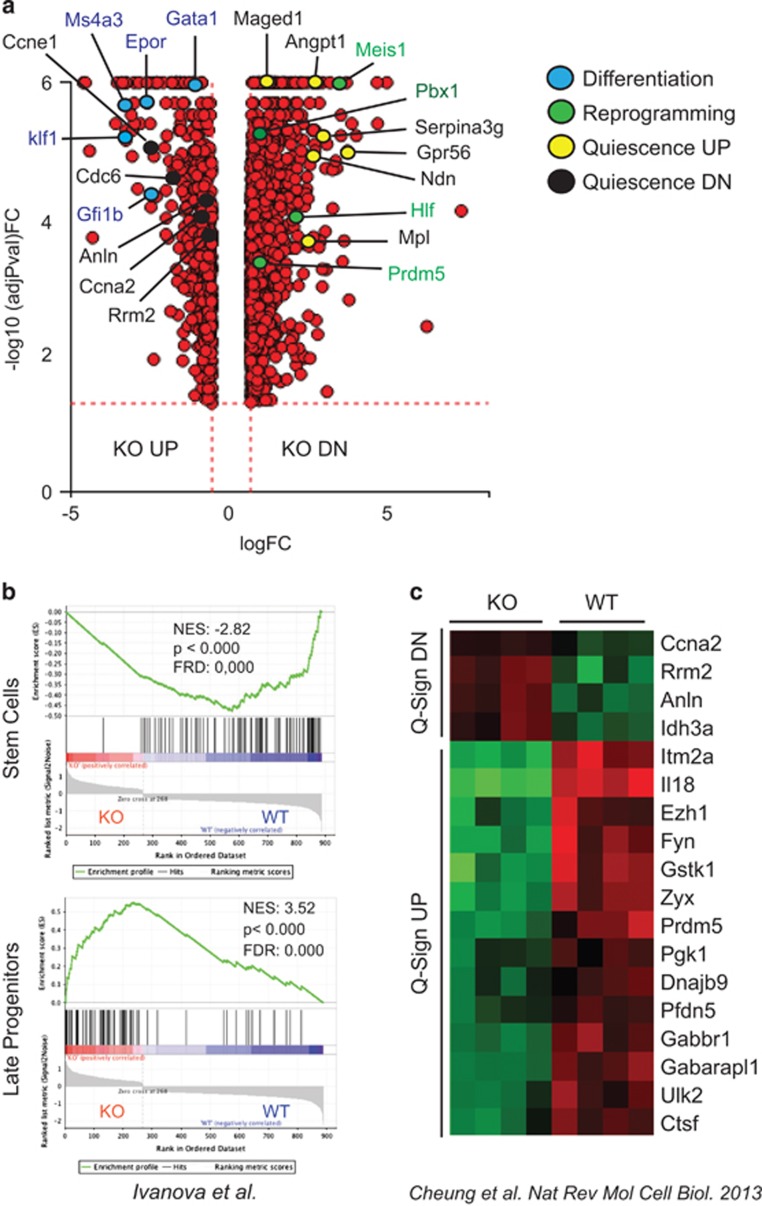
Camkk2 regulates transcriptional program of hematopoietic stem cells. (a) Volcano plot comparison of DEGs in KSL cells isolated from BM of Camkk2 null and control mice (WT and KO, respectively). Genes downregulated or upregulated in KO compared with WT are indicated as KO DN and KO UP, respectively. Color dots indicate genes involved in the regulation of differentiation or reprogramming of mature hematopoietic cells to HSC. (b) GSEA of microarray data shows that gene signatures for genes enriched in hematopoietic stem cells are significantly downregulated in KO KSL (upper). In contrast, genes enriched in late progenitors are significantly upregulated in KO KSL (lower). (c) Loss of Camkk2 downregulates the quiescent gene signature in stem cells. Heatmap represents DEGs in quiescent stem cell signature. Q-Sign DN and UP indicate genes downregulated and upregulated in quiescent stem cells. The color key of heatmaps indicates row-wise scaled RPKM values (z-score)

