
Figure 2.
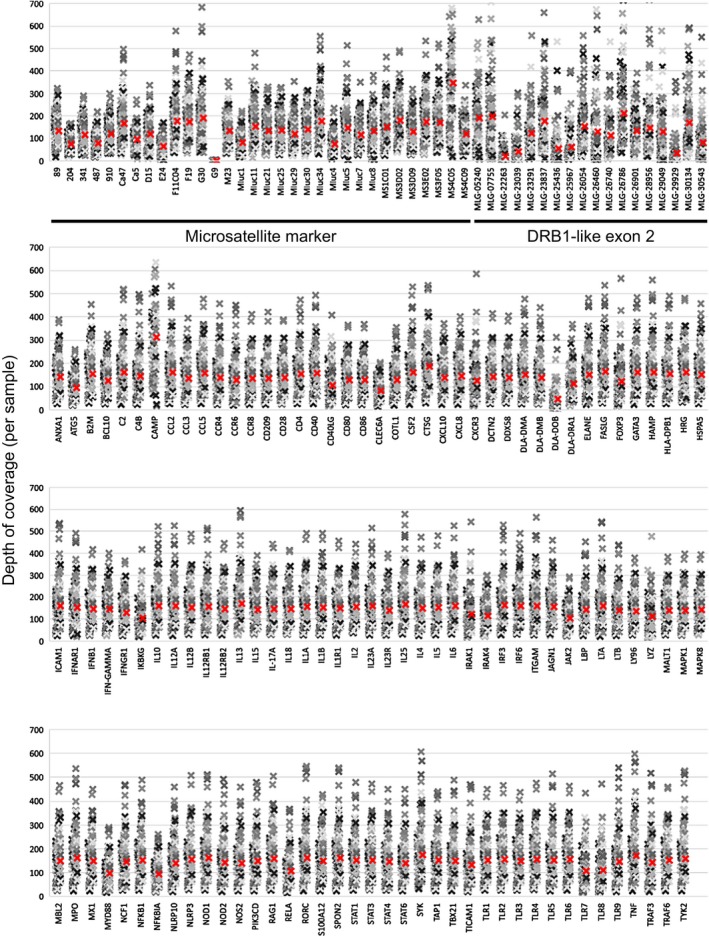
Primary target depth of coverage per sample, sorted by locus. Mean depth of coverage for each locus is indicated by a red colored “x.” Microsatellite markers and Drb1‐like exon 2 targets are marked in the top panel. We condensed the presented data by abbreviating Ensembl‐derived Myotis lucifugus gene (MLG) identifiers, where “MLG‐”=“ENSMLUG000000,” for the Drb1‐like genes that did not have informative Ensembl or GenBank gene names