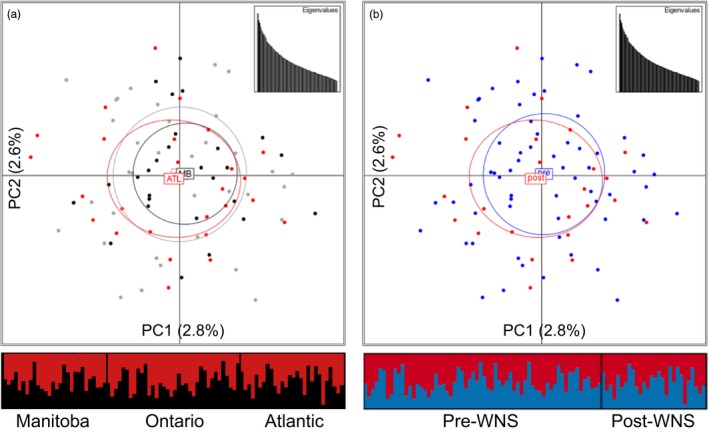
Figure 3.

Visualizing lack of genetic structure using 1,038 putatively neutral SNPs (>100 kpb from nearest gene) with max‐missing genotype of 5% and minor allele frequency of 2% for Myotis lucifugus (n = 92). Samples were grouped based on (a) geographic location or (b) previous exposure to WNS. Principal component analysis plots were produced using adegenet, and the percentage of variation for each axis and a scatter plot of eigenvalues are included for each analysis; barplot shows results of structure analysis (K = 2). MB = Manitoba (black); ON = Ontario (gray); ATL/post = Atlantic Canada/post‐WNS (red); pre = pre‐WNS (blue)
