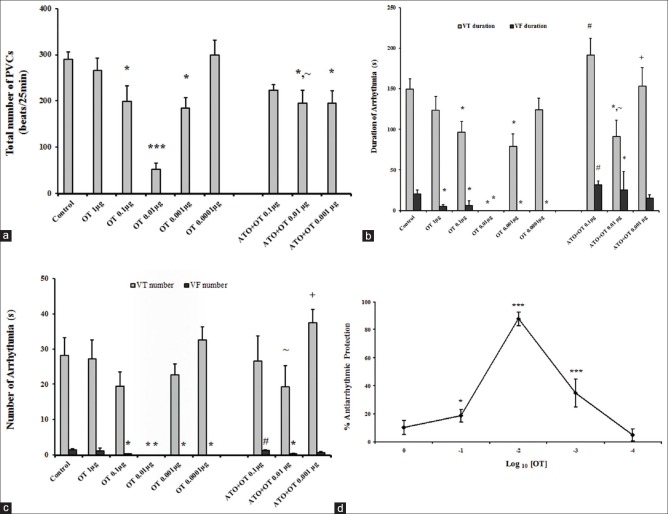
Figure 3.
Dose-response curves for oxytocin-induced suppression of ischemia-induced arrhythmias (a) number of premature ventricular contractions. (b) Sum of durations of ventricular fibrillation and ventricular tachycardia. (c) Sum of episodes of ventricular fibrillation and ventricular tachycardia in control and the treatment groups. Data are mean ± standard error of mean *P < 0.05, oxytocin versus control. #P < 0.05, ~P < 0.05, and +P <0.05 compared to oxytocin 0.1, oxytocin 0.01, and oxytocin 0.001 μg, respectively. (d) Antiarrhythmic dose-response curves of oxytocin relative to the arrhythmia score in the control group, as described in the methods section. Each point represents the mean percent protection ± standard error of mean *P < 0.05 and ***P < 0.001

