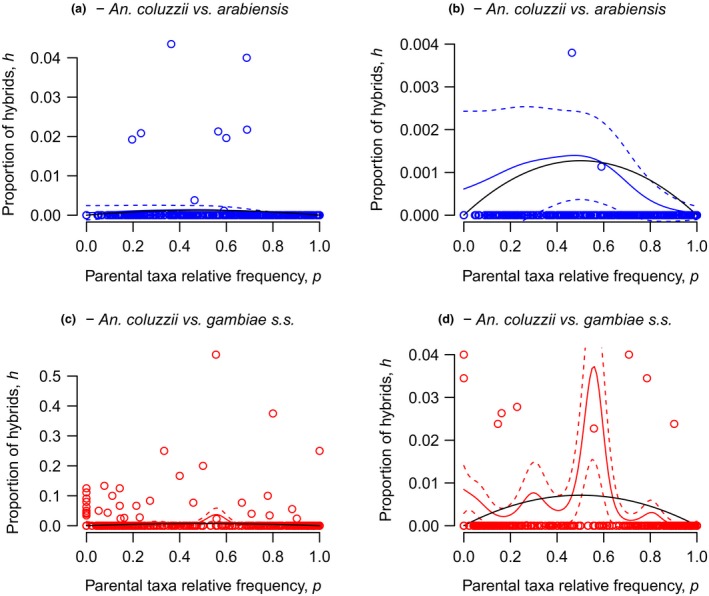
Figure 3.

Frequency‐dependent hybridization in Burkina Faso. Observed prevalence of adult hybrids (ĥ) plotted against the estimated relative frequency of the parental taxa in the population (p̂), with each dot representing a sample from a single locality. (a, b) Anopheles coluzzii × arabiensis; (c, d) Anopheles coluzzii × gambiae. Panels (b) and (d) show the same data as panels (a) and (c), respectively, with the ordinate cropped for visualization purposes. The continuous coloured curves in the four panels (±2SE, dotted coloured curves) represent the predicted values of h from the GAM models including a nonparametric smoothed function of p. The black inverted parabolas depict the theoretical expected frequency of hybrids from Hardy–Weinberg expectations when only a fraction of individuals in the populations mate at random and a fraction s*/s of heterogamous zygotes survive
