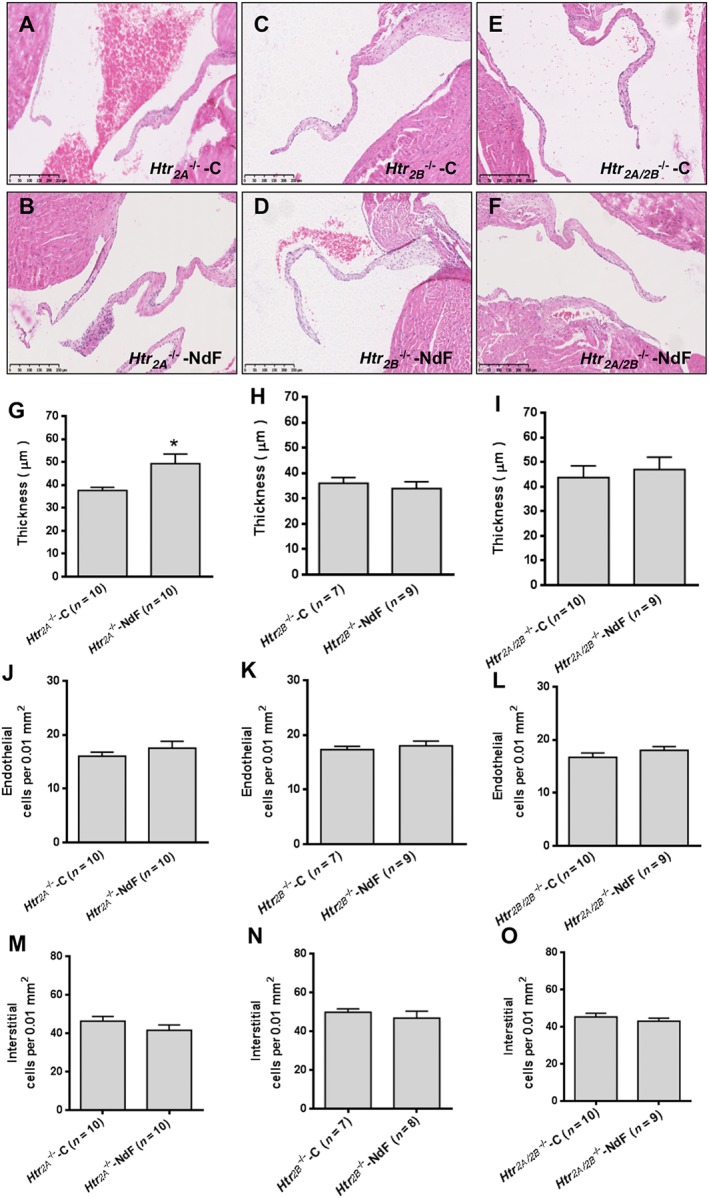
Figure 3.

Effects of NdF in Htr 2A −/−, Htr 2B −/− and Htr 2A/2B −/− mice. (A) to (F) correspond to typical histological aspects of the different Htr 2 KO mice lines (Htr 2A −/−, Htr 2B −/− and Htr 2A/2B −/−) (controls and treated for 28 days with NdF (1 mg·kg−1·day−1) stained with haematoxylin and eosin (scale bar = 250 μm); (G), (H) and (I) represent measured thickness; (J), (K) and (L) represent endothelial cells count; and (M), (N) and (O) represent counted interstitial cells count. Values are means ± SEM (n = number of animals per group). Statistical significant difference by unpaired t‐test versus KO control is indicated by * P < 0.05, significantly different from the corresponding KO control; unpaired Student's t‐test.
