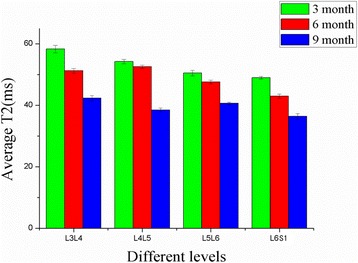
Fig. 4.

Measured T2 values from regions of interest (ROIs) in the nucleus pulposus plotted over the L3–L4 to L6–S1 disc levels from sagittal mid-axial images of rats of different ages. Comparison of T2 values between the different lumbar levels revealed differences statistically with age (P < 0.05, respectively) (L3–L4 represent the intervertebral disc between the third and the fourth lumbar vertebra, and so on)
