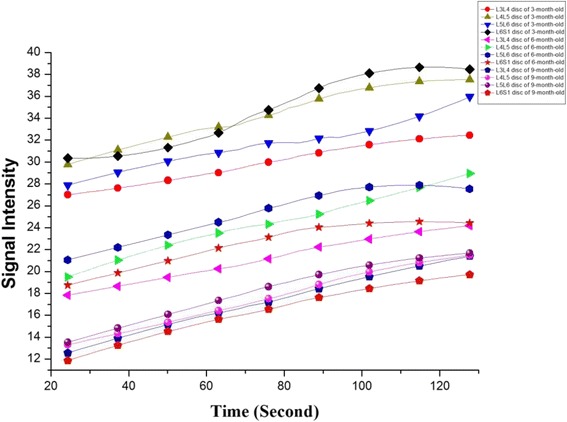
Fig. 6.

Dynamic MRI enhancement curve of different lumbar levels in different ages. Disc enhancement patterns show progressive increase within 2 min. Similar enhancement curve is seen in lumbar levels with different ages (L3–L4 represent the intervertebral disc between the third and the fourth lumbar vertebra, and so on)
