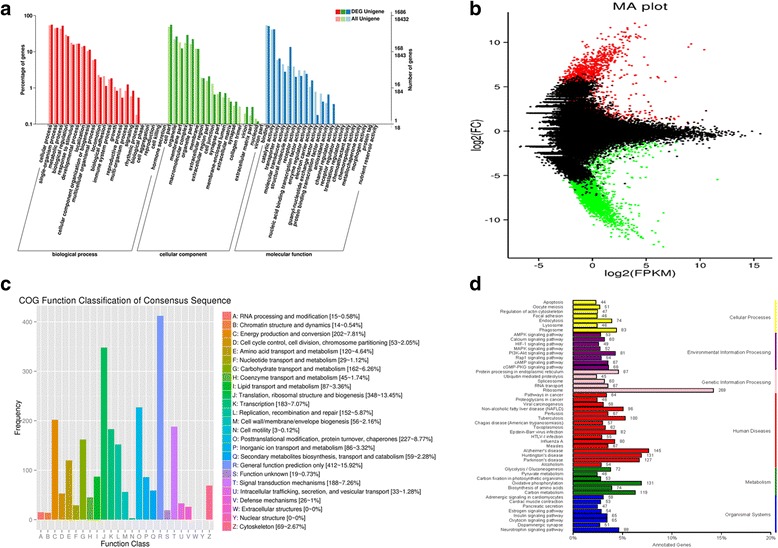
Fig. 4.

Transcriptome profiles of the HCBD and control groups. a GO annotation of all unigenes and DEG (differentially expressed) unigenes; b MA plot of differential gene expression levels in the two groups, where expression intensity is on the x-axis (log2 FPKM) and differences in the gene expression levels (fold change) are on the y-axis (log2 FC), each dot represents one gene, the log2 (FC) is plotted against the mean expression level for each gene, red dots represent genes whose abundance is significantly up-regulated, green dots - down-regulated, and black dots unchanged (or non-significantly changed) regulation; c COG annotation of and DEGs; d KEGG annotation of and DEGs
