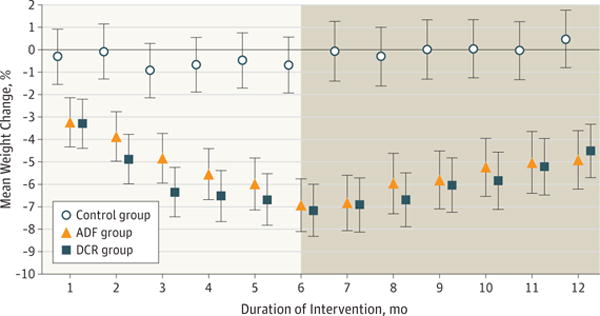
Figure 3. Weight Loss by Diet Group Relative to Baseline.

Data were included for 100 participants; mean (SD) values were estimated using an intention-to-treat analysis with a linear mixed model. Error bars indicate 95% CIs for weight change from baseline by diet group at each time point (1–12 months). ADF indicates alternate-day fasting; DCR, daily calorie restriction.
