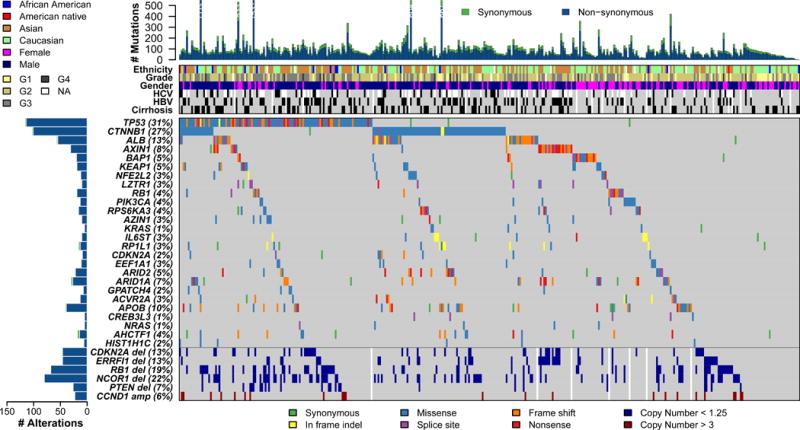
Figure 1. The genomic landscape of liver hepatocellular carcinoma and mutational signatures.

Top panel shows individual tumor mutation rates while the middle panel details ethnicity, tumor grade, age, gender, hepatitis C virus (HCV) and hepatitis B virus (HBV) infection status, and cirrhosis for 363 HCC. Bottom panel shows genes with statistically significant levels of mutation (MutSig suite, false discovery rate, 0.1) and mutation types are indicated in the legend at the bottom. The bottom six rows display significant DNA copy number alterations in likely cancer driver genes.
