
Figure 5. P53-induced gene target expression signature for improved clustering of HCC molecular and biological attributes.
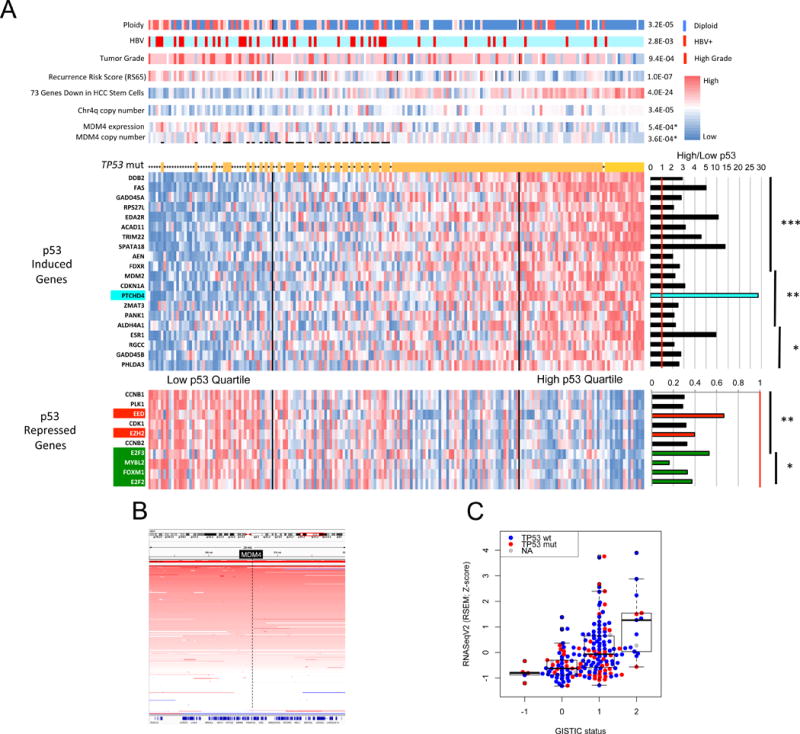
(A) Clustering of 191 HCC by composite expression of known p53 target genes. An expression heat map of 20 p53-induced target genes is shown above that of 10 p53-repressed target genes. To the right are shown mean expression ratios of top quartile p53 target genes relative to bottom quartile. Asterisks indicate level of significance. ***P<1E-10, **P<1E-07, *P<1E-04. Above the p53 target heat map asterisks indicate tumors with a TP53 mutation. Top bars show molecular and clinical attributes and correlation (p values) with high and low p53 target gene expression. MDM4 copy number and expression are significantly increased in those HCC with wildtype TP53 and with low p53 target expression relative to all other HCC (p values with asterisks). (B) Frequent copy number amplification of MDM4 gene in HCC. A segment of chromosome 1 centered on the MDM4 locus (in black box) is shown. The intensity of red bars corresponds to degree of copy number gain. Each horizontal line corresponds to a single tumor. (C) MDM4 copy number gain and amplification correlates with increased RNA expression. RNA expression for each tumor is represented by a red dot (mutant TP53) or blue dot (WT TP53) according to MDM4 copy number (−1 = deletion, 0 = diploid, 1 = copy number gain, 2 = amplification).