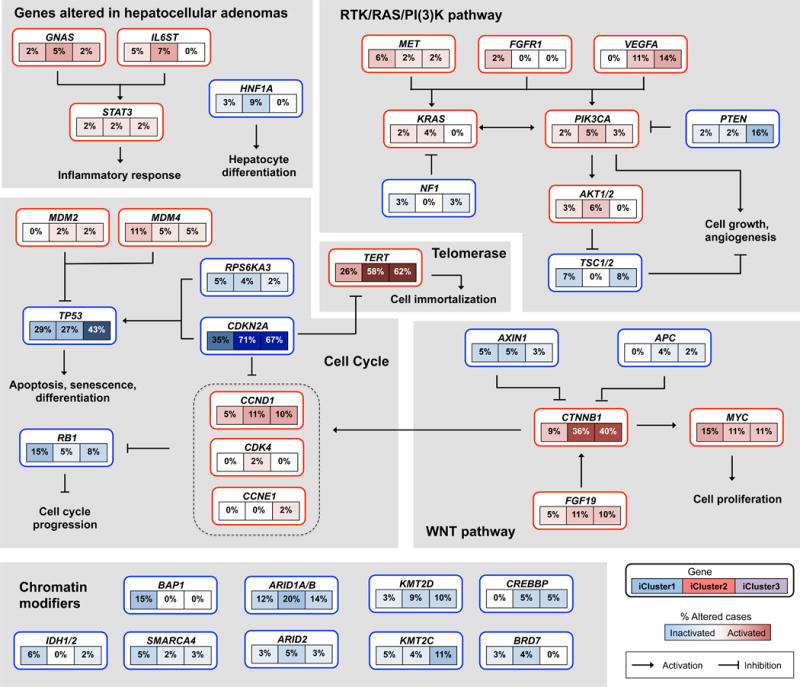
Figure 6. Integrated molecular comparison of somatic alterations in signaling pathways across iCluster groups.

Each gene box includes 3 percentages representing the frequency of activation or inactivation in iCluster 1, 2 and 3 based on the core 196 sample HCC dataset. All somatic changes are tallied together in calculating the percentages of altered cases within each of the iCluster sample groups. Somatic alterations include mutations and copy-number changes (homozygous deletion and high-level amplifications), as well as epigenetic silencing of CDKN2A. Missense mutations are only counted if they have known oncogenic function, have been reported in COSMIC, or occur at known mutational hotspots. Genes are grouped by signaling pathways, with edges showing pairwise molecular interactions.
